Our active perspective means we can help you see opportunities and risks differently. Discover how to strengthen your investments.
The Active Edge
GIVE YOURSELF A HEIGHTENED PERSPECTIVE
The merits of patient investing in a high-speed age
Read more
There is a flawed assumption that equity markets present a ‘zero-sum game’, in which an active manager can’t beat passive strategies. But the emergence of new investors has created more opportunities for active managers to outperform.
Think the US large cap market is too efficient for active managers to outperform? Time to think again
Our latest insights
Investors who want to beat the market—and avoid competing with algorithms—can benefit from ignoring the noise and focusing on stock fundamentals.
Investors see the value of active management as volatility intensifies
Fortune favours the small… and brave
Previous insights
The old “active vs passive” debate is dead – here’s why
Building portfolio resilience: why today’s approach needs to be different
Where is the familiar scepticism toward active management? Weren’t active investment strategies, especially in liquid markets like the US, supposed to be facing extinction? That was only a few years ago, but the debate has moved on by leagues. The binary poles of active and passive are less relevant by the day. For one, there has been an explosion in recent years of passive funds which do not track broad indices: they focus instead on themes, styles, regions or other sub-categories. They may be passive, but the process of using them as building blocks within a portfolio is distinctly active. Other factors are also driving a re-appraisal of the stereotyped active v passive standoff. For instance, market volatility of recent months has brought home the concentration risk bound up in broad indices, whether these are global or US. Almost three quarters of the MSCI World Index is made up of US companies and just ten stocks, primarily tech, comprise half of that. To be fair, passive participation in the journey to that concentration has worked well for investors. Since 2010 the S&P500 has produced annual returns of almost 14%. As the dollar strengthened and US equities cemented their dominance, they significantly outperformed other world markets. But the dangers were brought home sharply in April’s sell-off triggered by Trump’s “Liberation Day” tariffs. Complacency rapidly evaporated.
The use of assets is evolving, and growing appetite for private markets is changing the story
Return to home
Group CEO of Schroders
As investors grasp the dangers of market concentration and turn increasingly to specialist investment vehicles and private markets, it’s time we acknowledge that active investment management is about far more than stock selection.
Richard Oldfield
What we’re seeing among investors now is a more deliberate approach, and a need for strategy. In Schroders’ latest Global Investor Insights Survey – conducted among 995 professional investors from around the world representing $67 trillion in assets – 80% of respondents say they are more likely to use actively-managed strategies in the next 12 months. The survey was undertaken in April-May. Investors now want to build resilience into portfolios, and they’re looking to do it by diversifying across geographies, styles and asset classes. Many are reducing dollar exposure. This is a noteworthy reversal: the previous reflex at times of uncertainty was to view the dollar and US assets as safe havens. Capital is now shifting to Europe, Asia, or emerging markets. It’s also about style. Confronted with the pitfalls of an index, investors want an approach which is anticipatory or contrarian. For much of the past two decades macro factors (low interest rates, abundant liquidity, US exceptionalism) have lifted all assets. With a backdrop of increased volatility, micro factors (individual companies’ earning resilience, for example) are now coming to the fore. The need to look ahead is more pressing. What lies around the corner? One solution could be a value approach, where underpriced holdings offer a safety margin; others could be thematic, anchored on an industry or trend.
Aside from today’s yoyo of US policymaking, there are underlying global problems which will long outlive Trump’s presidency. One is ballooning sovereign debt. This is a major cause of fixed income market uncertainty: yields will be higher, but there will be higher structural volatility. So where investors seek income, bonds may be the answer – or one part of it. Another eye-catching outcome of the Global Investor Insight Survey was that private debt and credit alternatives are soaring in popularity. They are now the most attractive assets for investors wanting income. If a future income solution is one which offers both public and private debt together, that makes the traditional debate between active and passive fade to irrelevance. The same goes for public and private equity.
Distributed ledger tech, AI and cheaper computing are propelling us towards investment solutions that will be more sophisticated – more investor-specific – than the familiar fund structures of today. Private investors will have tailored portfolios geared around personal goals and dates. Pension funds will have sustainability preferences embedded in portfolio construction. The simplistic poles of passive vs active – far less relevant than the main aim of solving the investor’s problem – don’t belong in this picture. One swallow doesn’t make a summer, and future capital flows will be the proof of my argument. The rise of passive investing has been a theme of the investment industry for the past 25 years, but it’s been a story shaped by the investment industry, not necessarily by what’s best for investors. Now we’re at a turning point.
New technologies will bring the focus back to investors’ needs
Whether building portfolio resilience, seeking return opportunities, generating income or decarbonising your portfolio, we offer a heightened perspective to help you stay ahead. Learn more on our active perspective
Give yourself The Active Edge.
“Investors now want to build resilience into portfolios, and they’re looking to do it by diversifying across geographies, styles and asset classes”
Head of Multi-Asset Growth and Income
Remi Olu-Pitan, CFA
Read the rest of article to explore what structural changes mean for financial markets and how to achieve portfolio resilience.
Discover more
“Today private equity and debt form a combined $13 trillion market, up from less than $1 trillion two decades ago”
For decades, diversification strategies focused on the two traditional asset classes: stocks and bonds. The use of these assets evolved significantly, but they remained core building blocks. Two critical factors had to remain in place, however, for this strategy to keep working: a low correlation between the two asset classes and limited volatility for bonds, given the reliance on them as a source of stability. Among other structural market changes, these two factors are no longer in place. As a result, an era of simplistic portfolio construction – with its reliance upon asset class assumptions that no longer hold true – is over. Creating resilience within portfolios requires a new approach and a new asset mix.
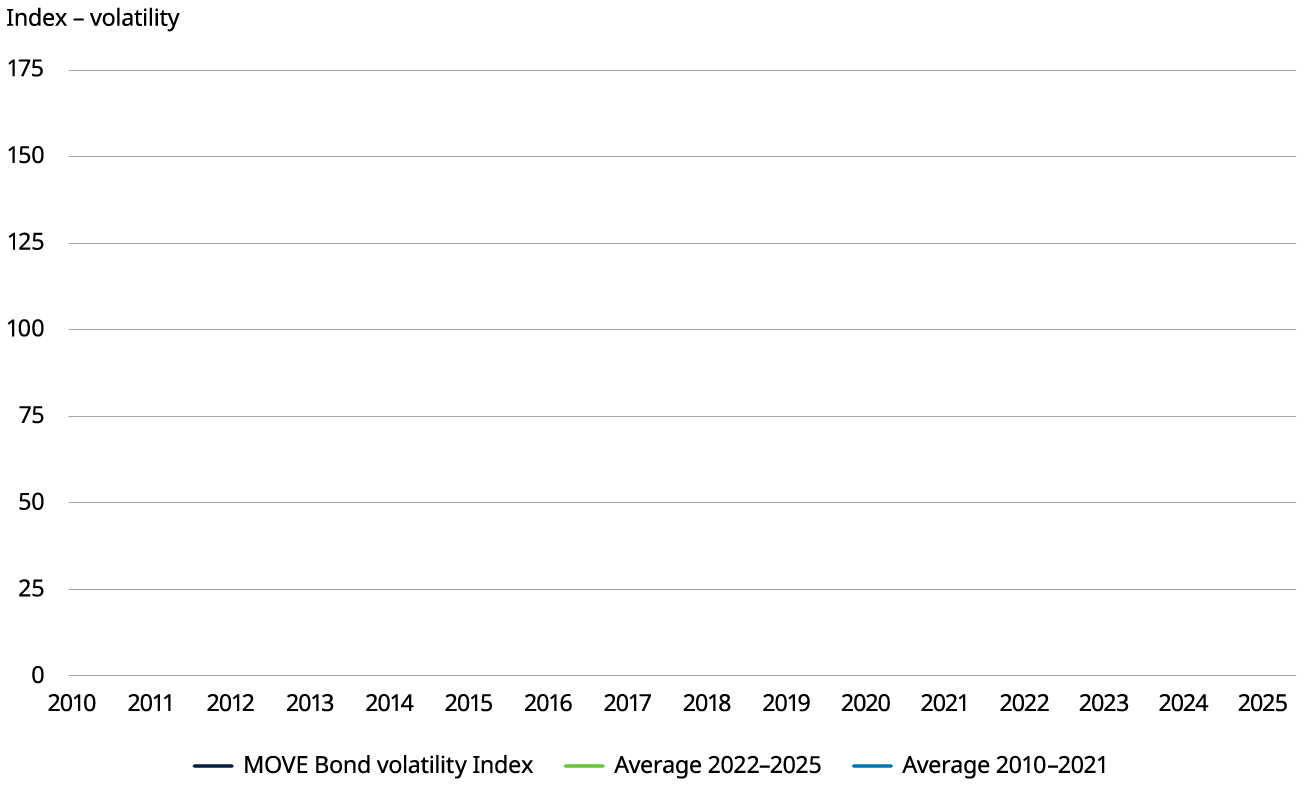
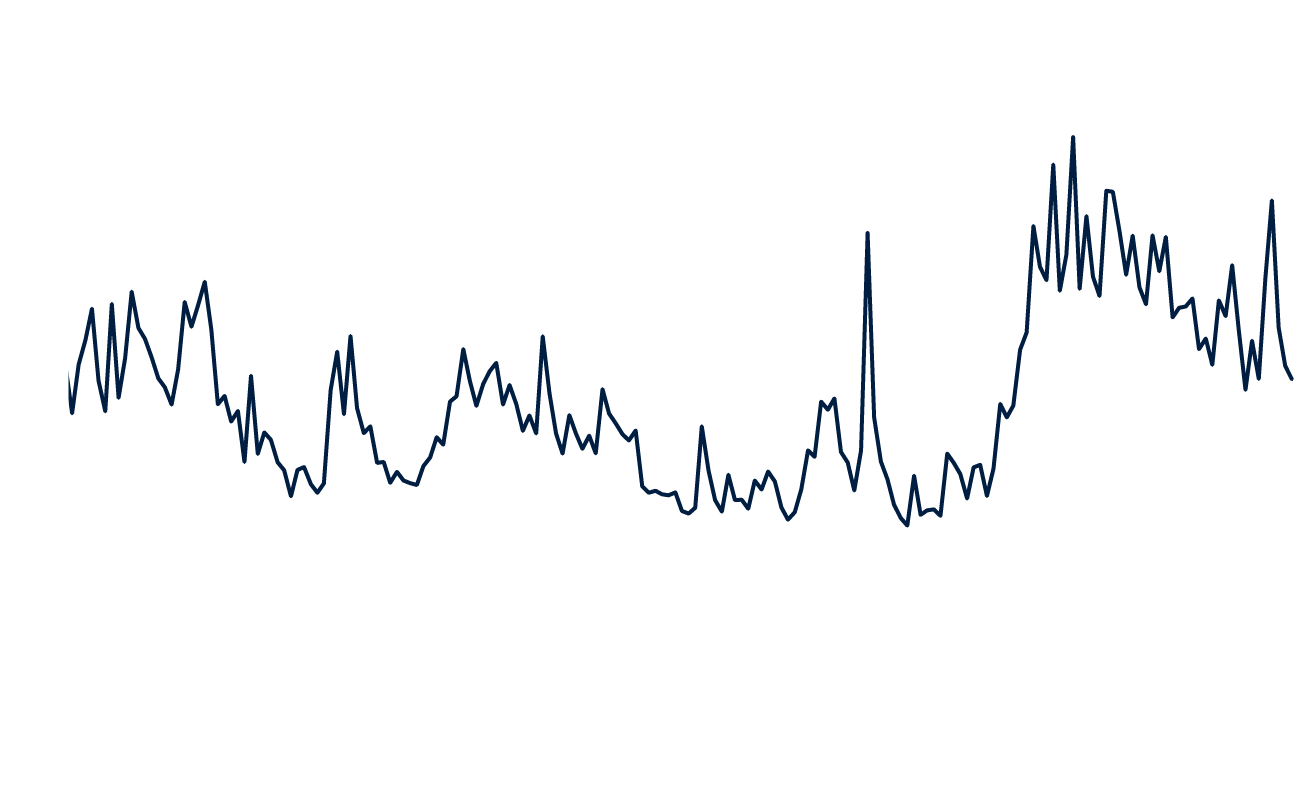
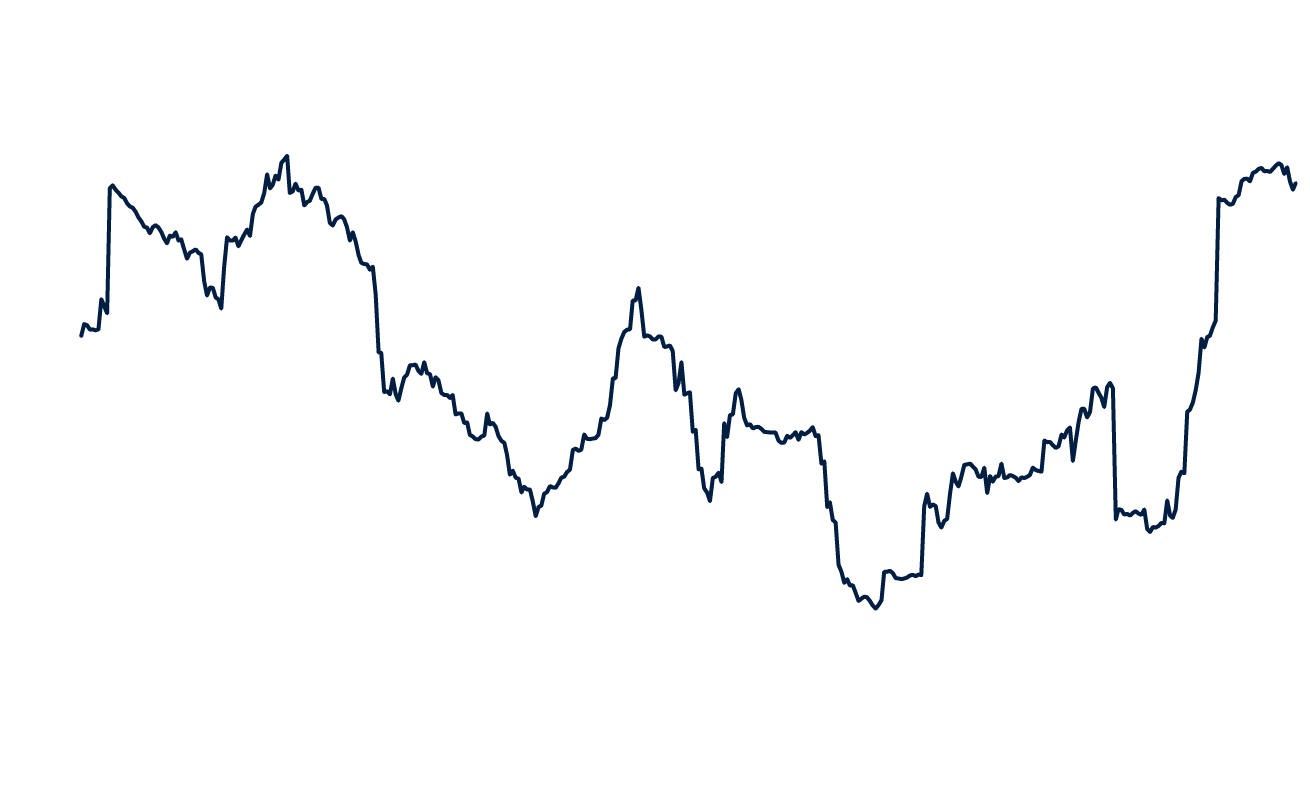
In the “safety first” period after World War II, investors considered capital preservation their top priority, and portfolios were weighted heavily toward fixed income. As the long-term growth that equities could deliver became increasingly apparent in subsequent decades, the 60/40 approach to diversification emerged. Even as investors pursued the higher long-term gains stocks offered with a 60% allocation, keeping portfolios 40% invested in fixed income proved a reliable means to achieve stability. Some investors even sought exposures beyond 100% limits of their portfolios by deploying leverage. By the late 1980s, many large institutions began to add alternative investments, including private markets, to their allocations. By the early 2000s, the allocation to “alts” among large institutional investors often reached 15%-20%. But for most individual investors, small institutional investors, and many defined contribution retirement plans, the 60/40 portfolio remained the trusted approach to diversification. Markets helped: from the mid-1990s to 2021, a low, often negative, correlation between stocks and bonds contributed to the effectiveness of the 60/40 approach. Recent years have confounded those expectations. Since 2022, global bond markets have been much more volatile (Chart 1) and that has made bonds a less dependable source of returns (Chart 2).
Asset allocation: what worked in the past, and why it’s not working now
To understand why the old assumptions no longer work, it’s important to consider how the environment has changed and whether current circumstances will persist. We identify several long-term trends and resulting market conditions that we believe will extend into 2026 and beyond. Increasing government debt Government debt levels continue to soar, particularly in developed economies. Politicians have shown an unwillingness to address the underlying issues, creating uncertainty in bond markets which were previously considered creditworthy. Aging populations In most developed and several emerging markets, aging populations result in shrinking workforces and are likely to exacerbate government debt challenges. Interest rates to remain higher Even without the potentially inflationary US tariff proposals laid out by the Trump administration, several factors look set to keep inflation high. These include tight labour markets, lingering supply chain constraints, ongoing deglobalisation and the longer-term costs associated with decarbonisation. The period of near-zero interest rates is squarely behind us.
Recognising structural external changes...
Structural changes in financial markets mean we need a different mix of asset classes to deliver dependable returns.
1. Since 2022, bonds have exhibited much higher levels of volatility
Source: Bloomberg, Robert Shiller, Schroders, LSEG Datastream. As at 11 July 2025. Past performance is not a guide to future results.
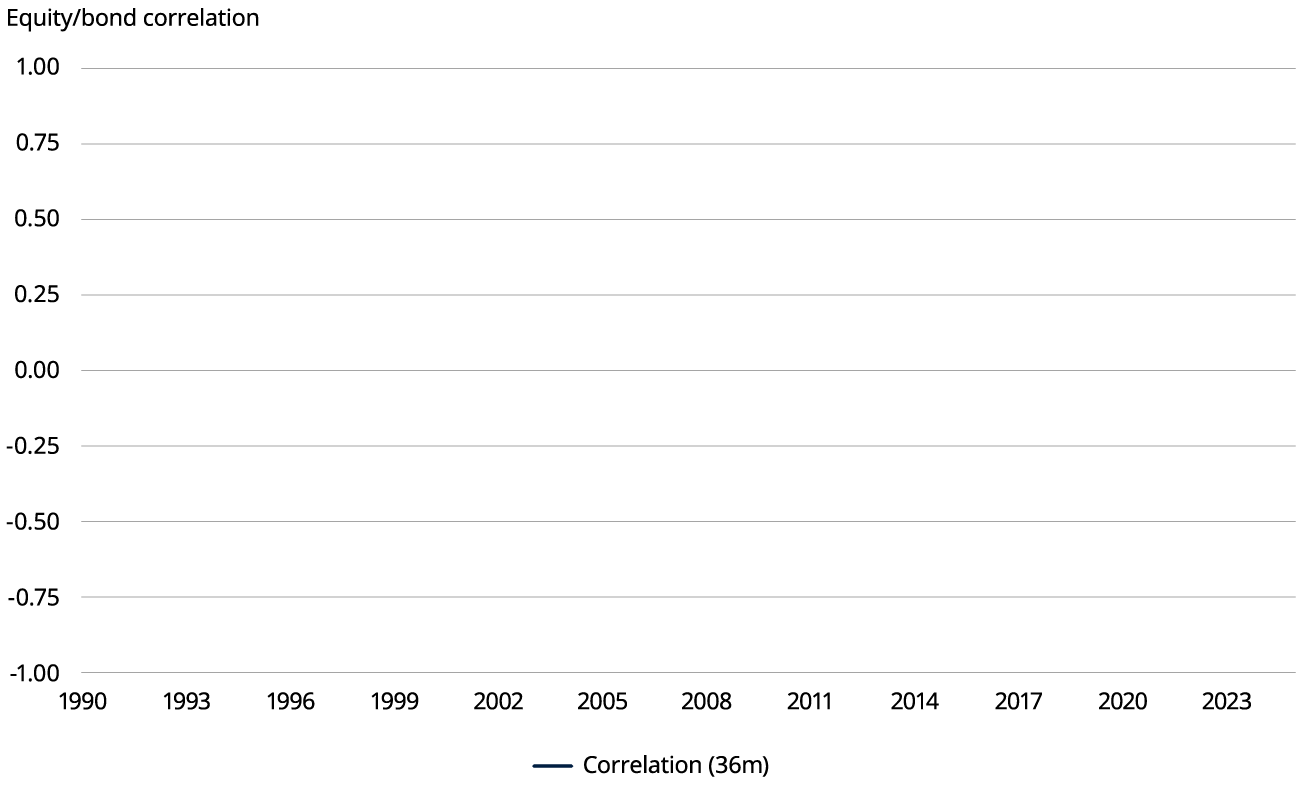
The correlation between bond and equity returns rose significantly in the aftermath of the Covid-19 pandemic from a combination of factors that adversely affected both markets, including a spike in inflation driven by supply-chain challenges, soaring interest rates, a surge in commodity prices and geopolitical turmoil (Chart 3). The correlation has remained at elevated levels. As a result of all this, the 60/40 portfolio experienced severely negative returns, as exemplified by a US-focused portfolio. With its exposure to the S&P 500 Index and US Treasury bonds, the 60/40 portfolio was down nearly 18% in 2022, posting its worst year since 1937.1
Source: Global Government Bond Index. Bloomberg, Robert Shiller, Schroders, LSEG Datastream. 31 December 1990 = 100. As at 11 July 2025. Past performance is not a guide to future results.
2. With recent volatility, bonds struggled to deliver reliable returns
Source: Robert Shiller, Schroders, LSEG Datastream. Equity returns are represented by the returns of the S&P 500 Index; bonds, by the 10-year US Treasury. As at 11 July 2025. Past performance is not a guide to future results.
3. Correlations between stocks and bonds have turned highly positive
The comparatively benign years that followed the financial crisis of 2008-2009, when equities soared amid a backdrop of near-zero interest rates and low inflation, are over. Slower growth and persistent inflation raise concerns for both bond and equity markets and suggest consistently higher volatility. Along with this volatility, the correlation between stocks and bonds is likely to remain high. In this changed scenario although bonds may be less reliable as diversifiers, the return of higher yields makes them potentially attractive sources of income. Shifts in market composition are also a factor, and that means investors need to look to a broader range of assets to meet their needs. The universe of equities quoted on the world’s major public stock markets continues to shrink. More companies are now raising finance via private market channels. Today private equity and debt form a combined $13 trillion market, up from less than $1 trillion two decades ago. Within the sphere of public equities market composition has also changed. The post-financial crisis period saw the emergence of mega-cap US stocks as a dominating force in global indices. By the start of 2025, US equities comprised over 70% of the MSCI World index and much of this dominance was due to fewer than 10 stocks.
…and distilling what they mean for financial markets
Give yourself The Active Edge. Whether building portfolio resilience, seeking return opportunities, generating income or decarbonising your portfolio, we offer a heightened perspective to help you stay ahead. Learn more on our active perspective: What we do | Schroders
“Four in five investors say they are more likely to invest more into actively-managed strategies in the coming 12 months”
As investors around the world acknowledge significant risks in 2025 and beyond, a large majority (75%) also believe actively managed strategies offer value in current markets. An even bigger proportion – four out of five – say they will increase ther investment in active strategies over the coming 12 months. Schroders Global Investor Insights Survey, which polled the attitudes of almost 1,000 professional investors from around the world, captured the shift in market sentiment which occurred in the first half of 2025 triggered in large part by US trade policy announcements. The survey was undertaken from mid-April, a fortnight after President’s Trump’s so-called “Liberation Day”, on which initial US tariff policies were declared. Markets fell sharply in response.
Investors were asked to rate their greatest concerns on a scale of one to four. The vast majority (63%) cited US trade and tariff policy as their chief worry. However, economic performance, inflation and higher interest rates also featured. After tariffs, the next three areas of concern – economic downturn, higher inflation and higher interest rates – were broadly equal in ranking. This ties in with another major source of financial market volatility during the first half of 2025: questions over the sustainability of national debt for major global economies including the US, Japan and other G7 countries. Higher interest rates are pushing up the debt-servicing costs of the world’s biggest economies. Weaker economic growth would likely worsen this position. Bond markets have experienced volatility as a result, and the survey findings suggest investors anticipate more related uncertainty ahead. When asked to rank their assessment of volatility today against previous market shocks, one in four respondents said they expect greater volatility in the coming 12 months compared to both the COVID-19 epidemic and the global financial crisis of 2008.
Global trade policy ranks as investors’ primary concern, but economic growth and interest rates are also on the radar
Four in five investors say they are more likely to invest more into actively-managed strategies in the coming 12 months. This is linked to other findings where investors see active management as better suited to successfully navigating a more complex period in markets than a passive index-tracking approach. When asked to identify which attributes of active management held the greatest appeal, respondents cited a range of factors, first of which was the ability to capture returns wherever they arise. Achieveing portfolio resilience was the second most valued attribute. Active management was also seen to bring "deep specialist knowledge". Johanna Kyrklund, Schroders’ Group CIO, said: “The wider backdrop is that financial markets are still adjusting back to structurally higher interest rates, made painful in many cases by high levels of debt. This is raising questions about future market trends and the value of passive approaches in a period of greater uncertainty.”
Portfolio resilience is associated with active investment strategies and a mix of public market and private market assets
With rising uncertainty on their radar, investors seek to make their portfolios more resilient. They see active investment management as key to the solution.
What do you consider to be the most significant macro-economic considerations impacting your investment strategy in the next 12 months?
Source: Schroders Global Investor Insights Survey 2025. Respondents were surveyed from April-May 2025. Respondents were asked to rate on a scale of 1-4 where 1 = Significant influence. % Rank 1.614988
Given the above volatility and the risks perceived by investors, achieving “portfolio resilience” was the goal of the majority of investors (55%), ahead of return generation and income. “Portfolio resilience” is not to be confused with risk aversion. A majority of investors (62%) are maintaining or increasing their risk appetite in the current environment. This suggests that many see opportunities as well as risk within current volatility.
Source: Schroders Global Investor Insights Survey 2025. Respondents were surveyed from April-May 2025. 614988
Which of these indices give you the greatest cause for concern about market concentration? Select all that apply.
Source: Schroders Global Investor Insights Survey 2025. Respondents were surveyed from April-May 2025. For illustrative purposes only and not a recommendation to buy/sell. 614988
What are the factors that you most value from the active managers you currently work with? Select up to three.
While the high level of confidence in actively-managed investments was one of the stand-out themes of this year’s survey, so was the high degree of interest in using a mix of both public and private assets. When asked which two asset classes they would use to access the best return opportunities, 46% cited public equities and 45% cited private equities. Interestingly, the third asset class cited here (by 40%) was another private market category – private debt and credit alternatives (PDCA). Again, when it came to generating income, PDCA was a priority, with over 40% of both institutional investors and wealth gatekeepers looking to these assets to meet their income needs. High yielding publicly-traded equities and public-traded bonds came a close second and third. “The ability to access diversifying and flexible income through the wide universe of securitised and asset-backed finance provides a valuable extension of the fixed income toolkit for investors,” said Michelle Russell-Dowe, Schroders Capital’s Co-Head, Private Debt and Credit Alternatives.
Tariffs/protectionist trade policies
Economic downturn
Higher inflation
Higher interest rates for longer
Increased regulation
Supply chain distruption
Lower rates
Climate risk
0%
10%
20%
30%
40%
50%
60%
70%
63%
6%
5%
4%
1%
In public equities, the volatility sparked by US tariff announcements in April was an unwelcome reminder that markets had become increasingly concentrated around US equities, and around giant US tech companies especially. By the start of this year global indices, such as the MSCI World, comprised over 70% US stocks. So when asked which indices posed greatest concentration risk, three quarters of investors (74%) cited the US S&P500 index. The global MSCI World index was the next greatest cause for concern, likely due to its extreme US tilt.
Volatility has brought home the danger of market concentration
80%
S&P 500
MSCI World Index
MSCI Asia Pacific
MSCI Europe
MSCI Emerging Markets Index
FTSE All Share
Topix
Other
I'm not worried about market concentration
74%
32%
16%
15%
14%
8%
In the face of these risk factors, investors want to make portfolios more resilient
Ability to capture opportunities wherever they are
Enhancing portfolio resilience over the long-term
Deep technical and specialised knowledge
Focus on addressing my long-term goals
Thought leadership and investment education
Improved the value of holdings through engagement
Accessing global mega themes such as decarbonisation/ technological disruption
Rigorous research into companies and industries
52%
59%
48%
49%
47%
46%
43%
42%
44%
29%
27%
23%
24%
19%
18%
All (n = 995)
Institutional Investors (n = 745)
Wealth Gatekeepers (n = 250)
Head of Business Development Australia, Private Equity
Claire Smith
Read the rest of article including: Performance differentials between private equity managers Schroders Capital’s deal selection process Why fortune favours the small
“Why would one invest in a market segment that has a higher chance of loss? Only if you believe the manager can outperform the benchmark and so the potential rewards are greater”
It is a truism that generating a return over the risk-free rate requires taking risk. Some amount of risk aversion is part of prudent investing. But at what point does it work against the interests of investors? At what point does it poison the chalice? Recent research1 suggests that loss avoidance is not correlated with higher returns. This can be understood through the prism of loss ratios, defined as the realised or latest value of an investment below invested capital. If you invest $1 into a company, this covers the probability of receiving, or valuing the investment at, anywhere from $0 to 99c. According to authors Maria N. Borysoff of George Mason University School of Business and Gregory W. Brown of UNC Institute for Private Capital: “While loss avoidance during the fundraising period benefits fund managers, investors get a lower fund return from loss-avoiding GPs after the fund is fully realized… we show that the use of loss ratios as a risk metric is suspect, as there is no observable correlation between loss ratios and the standard deviation of deal MOICs [Multiple on Invested Capital] at the fund-level.” In other words, low loss ratios do not themselves contribute to higher returns for investors, and chasing them for their own sake can lead to sub-optimal results. By corollary, when undertaken with the appropriate skills and capabilities, operating in a riskier part of the market is justified when it offers more attractive returns over the long-term. Schroders Capital exists to deliver return for its investors over the long term, and that is why we invest in the small and mid-market. Small and mid-cap buyouts exhibit higher than average risk ratios, but they also offer more opportunity to outperform. Crucially, though, we do it with a platform that is proven, repeatable, and that helps offset the risk inherent in this part of the market.
Global private equity exhibits an overall loss ratio of 8.31%. The small and mid-cap segment of the market, defined as companies with an enterprise value of less than $1 billon, exhibits a loss ratio of roughly 100bps above that average, while large caps have a loss ratio roughly 300bps below it.
The juice is worth the squeeze
But achieving a low loss ratio in a part of the market with a higher than average loss ratio is not reason enough to invest. Indeed, why would one invest in a market segment that has a higher chance of loss? Only if you believe the manager can outperform the benchmark and so the potential rewards are greater. And they are greater. Schroders Capital's direct/co-investments have outperformed both the broader private equity market, defined using the Cambridge Associate Private Equity Index, and listed markets over five and 10-year time horizons.
Focusing too much on minimising risk in private equity can come at the cost of enhanced risk-adjusted returns. Concentrating on the smaller end of the buyout market – and being highly selective about managers and investments – could hold the key to maximising potential outperformance.
Preqin stats on industry losses
Source: Preqin, September 2024. PE Buyout deal level loss ratios covering all investments between 2004 –September 2024. % of Aggregated Deal amount: Loss amount total / invested capital total. Past performance is not an indicator of future performance and may not be repeated.
Schroders Capital’s direct/co-investment book lives in the small and mid-cap part of the market and has incurred a loss ratio of 8.1%.
Source: Preqin, Schroders Capital, 2024. Preqin PE Buyout deal level loss ratios covering all investments between 2004 –September 2024. Schroders Capital‘s loss ratio consistently defined as total loss amount value below 1x divided by total invested capital of all 199 growth and buyout direct/co-investments Schroders Capital has completed as of Q3 2024. All 199 growth and buyout direct/co-investments made by Schroders Capital have been included in the analysis. Past performance is not an indicator of future performance and may not be repeated.
Schroders Capital’s loss ratio versus Preqin industry averages
Source: Cambridge Associates LLC, Schroders Capital, 2025. The index is a horizon calculation based on data compiled from 2,879 private equity funds, including fully liquidated partnerships, formed between 1986 and 2024. CA Modified Public Market Equivalent (CA mPME) replicates private investment performance under public market conditions. The public index’s shares are purchased and sold according to the private fund cashflow schedule, with distributions calculated in the same proportion as the private fund, and mPME NAV is a function of mPME cashflows and public index returns. Schroders Capital 5/10-year horizon performance shown are as of Q3 2024 and net of underlying fund fees, expenses and performance fees, and gross of Schroders Capital’s fund fees, expenses and performance fees. Figures include 199 buyout and growth co-investments since 2013, the date of the first co-investment made by Schroders Capital. Past performance is not an indicator of future performance and may not be repeated.
Comparison of public, private and Schroders Capital returns
Having highlighted the outperformance Schroders Capital is able to generate in the small and mid-cap private equity market, let’s now dig into the factors driving this performance. We’ve written previously about the benefits of the small to mid-cap segment of the private equity universe, and why this part of the market generally outperforms the large cap part of the market. Small and mid-cap private equity covers only 30% of capital by dollar, but 99% of companies by number. In other words, in the large-cap segment more than 3x the amount of capital is fishing in an opportunity set which is approximately one hundred times smaller. This imbalance between capital supply and demand provides fertile ground for investment based on a far larger opportunity set and relatively less competition, providing high-quality investments at lower entry multiples (typically expressed as EV/EBITDA). This has been particularly pronounced over the past five years, which saw large-cap private equity capture an even greater share of fundraising. While small and mid-sized companies have always traded at a discount to large companies, this valuation gap has significantly widened over the last few years.
Vahit Alili
Senior Investment Director Private Equity
% of Aggregated Deal Amount
Loss Amount
Overall
Large Cap (≥ USD $1BN)
Small/Mid Cap (> USD $1bn)
Global
North America Focused
Europe Focused
8.31%
8.03%
8.15%
5.34%
5.55%
4.11%
9.37%
8.37%
9.64%
Loss ratio
2%
Schroders Capital
Large Cap (≥ USD $1bn)
Horizon return
25%
10 year
5 year
1. Source: Borysoff (Nykyforovych), Maria and Brown, Gregory W., Loss Avoidance in Private Equity (January 26, 2024). Donald G. Costello College of Business at George Mason University Research Paper, Kenan Institute of Private Enterprise Research Paper.
Schroders Capital PE
CA Private Equity Index
MSCI ACWI (CA mPME)
Portfolio Manager, Global Equities
Frank Thormann
Give yourself The Active Edge. Whatever your portfolio objectives we offer a heightened perspective to help you stay ahead, including through Schroders Capital’s pioneering track record and deep expertise in attractive, high-growth segments of the rapidly evolving private markets universe. Learn more: What we do | Schroders
“Previously, markets saw the predominance of patient investors with multi-year horizons. Now, many investors operate with a heightened sense of immediacy, holding stocks for months, weeks or less”
For many equity investors today, proven traditional strategies, like focusing on the long term, may seem quaint. There is a heightened urgency today to pursue short-term gains, as reflected in high trading volumes and much shorter holding periods. The emergence of algorithmic trading, hedge funds and passive strategies have intensified these trends but there is ample evidence that the tried-and-true methods still work. These include focusing on the long term and recognising that growth in corporate earnings has historically always been, by far, the primary driver of long-term equity returns. Traditional stock analysis, with its focus on company fundamentals remains an effective way to pursue market-beating returns. But it requires a rigorous and disciplined application to identify the companies poised to deliver growth that is not yet understood by the market. We outline below what that discipline entails, but first it is worth examining the current investment environment and why traditional investment strategies continue to demonstrate they offer the best way to pursue outsized returns.
A profound transformation has reshaped equity markets in recent decades. While previous eras saw the predominance of patient investors with multi-year horizons, many investors now operate with a heightened sense of immediacy, holding stocks for months, weeks or less.
Technology has enabled high-speed trading and short-term thinking, and neither leads to demonstrably better results
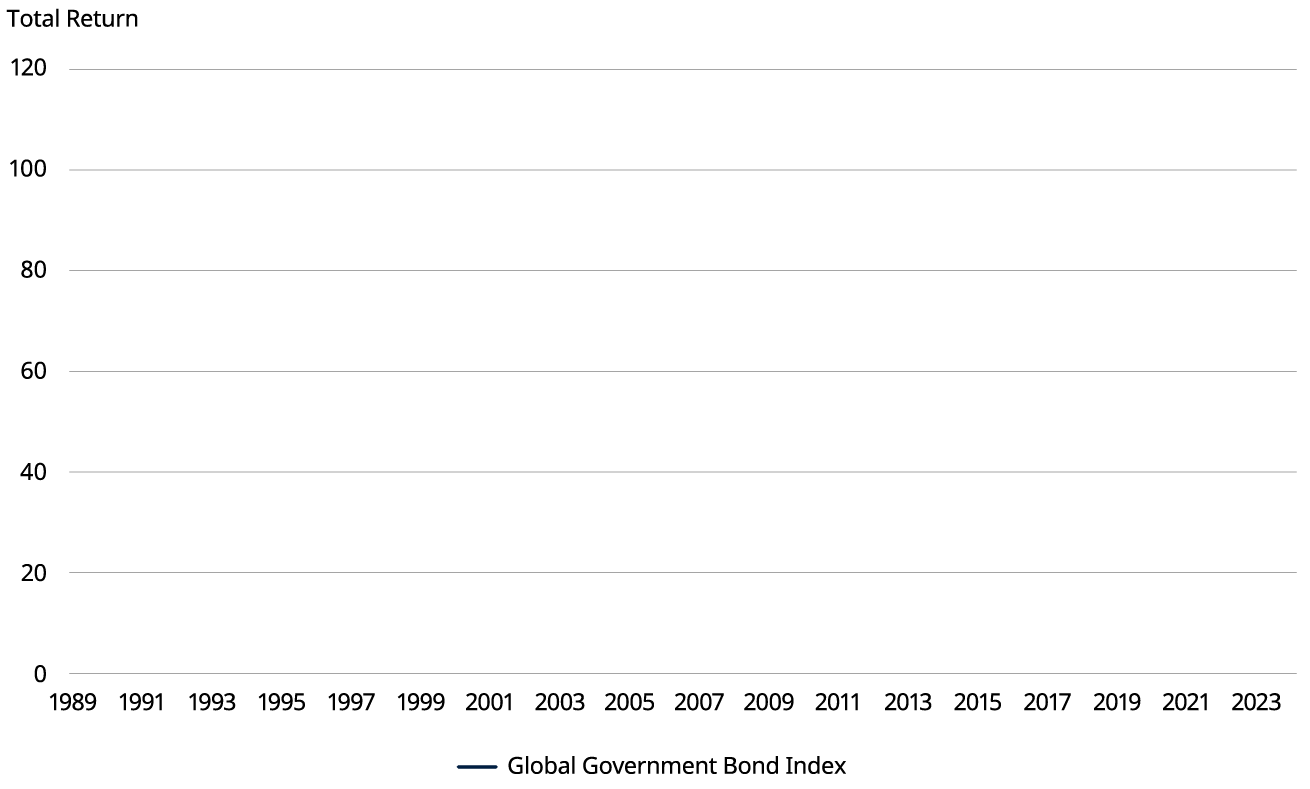
Figure 1: Investors’ horizons—and patience—have shortened
Source: World Federation of Exchanges, International Monetary Fund, New York Stock Exchange, and NASDAQ, market capitalisation divided by total turnover value.
Multiple forces converged to drive this shift. The rise of algorithmic and high-frequency trading dramatically reduced the cost and friction associated with executing trades. These technologies have enabled transactions to be undertaken in milliseconds rather than days or weeks. Hedge funds and similar vehicles have grown their presence in the equity markets. These investors deploy strategies that prioritise short-term gains, fast arbitrage chasing small price differences in the market, and tactical portfolio repositioning. Long-term thinking, with strategic allocations, is not typically an emphasis. The meteoric expansion of passive investment strategies has reshaped market dynamics. Exchange-traded funds (ETFs) and other index-tracking vehicles are major players in today’s markets. As a result, a substantial amount of trading is now influenced by automated, rules-based buying and selling, as well as the periodic repositioning these vehicles must carry out when the indices they track rebalance.
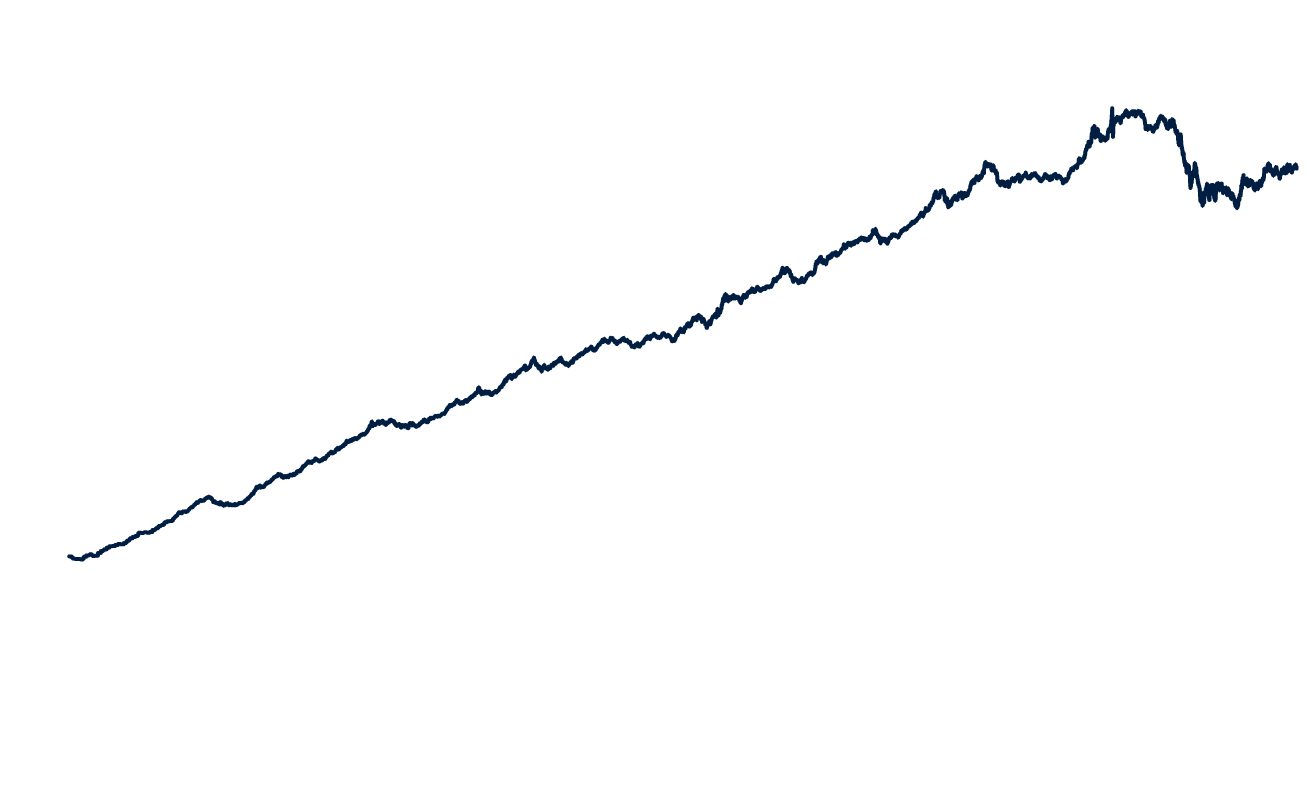
Figure 2: Markets often fail to look far enough ahead and miss the long-term benefits of competitive advantages
Average US equity holding period (in years)
“Mutual Fund Investment Horizon and Performance” Presented at the China International Conference in Finance (CICF) 2013. By Chunhua Lan, Fabio Moneta and Russ Wermers. And “For Professional Investment Fund Managers, 'Going Long' is a Winning Strategy,” University of Maryland Research, Russ Wermers, Fabio Moneta and Chunhua Lan, 2024 “Earnings Growth: The Two Percent Dilution,” Financial Analysts Journal, William J. Bernstein and Robert D. Arnott, September/October 2003 “Stocks for the Long Run: The Definitive Guide to Financial Market Returns & Long-Term Investment Strategies,” By Jeremy J. Siegel, McGraw-Hill Education, 6th Edition, 13 September 2022 “Size and Book-to-Market Factors in Earnings and Returns,” The Journal of Finance, Eugene F. Fama and Kenneth R. French, March 1995 “The Level and Persistence of Growth Rates,” The Journal of Finance, Louis K. C. Chan, Jason Karceski and Josef Lakonishok, 21 March 2023 “Value Investing: From Graham to Buffett and Beyond,” (A book), Bruce C. N. Greenwald, Judd Kahn, Paul D. Sonkin and Michael Van Biema. First edition published by Wiley in 2001 (2nd edition by Greenwald, Kahn and others .) “The Level and Persistence of Growth Rates,” The Journal of Finance, Louis K. C. Chan, Jason Karceski and Josef Lakonishok, 21 March 2002 “Do Stock Prices Fully Reflect Information in Accruals and Cash Flows about Future Earnings?” The Accounting Review, Richard G. Sloan, July 1996 “A Survey of Behavioral Finance,” Chapter 18 in the Handbook of the Economics of Finance, by Nicholas Barberis and Richard Thaler, Published by Elsevier. September 2022 “Do Analysts and Auditors Use Information in Accruals?” Journal of Accounting Research, Mark T. Bradshaw, Scott A. Richardson and Richard G. Sloan, June 2001 “More Than You Know,” Columbia University Press, Michael J. Mauboussin, 2006 Additional background material obtained from: “Institutional Holding Periods,” Cornell University, Bidisha Chakrabarty, Pamela C. Moulton, Charles Trzcinka* 29 April 2013
For investors pursuing returns above what the broad markets deliver, competing with these new players on their terms is pointless. The algorithmic traders already have the fastest trading systems. Herd-driven investing influences much of the flow into and out of passive strategies. To state the obvious, you can’t outperform the consensus when you are following it. The good news is that there is no need to do so. A wealth of academic research demonstrates that traditional strategies still offer promising routes to superior gains in equity markets. Longer investment periods have delivered superior results. One study found that institutional investors with the longest holding periods outperform their short-term oriented counterparts by about 3% per year.1 In other words, the markets ultimately reward those who resist short-term pressures and exhibit patience. Fundamentals still matter because long-term stock prices follow corporate earnings. Empirical analyses demonstrate that around 80% to 90% of long-term equity returns are directly attributable to growth in corporate earnings and dividends. This underscores how critical a company’s true underlying profitability is to determining the stock value.2,3 Additional studies have shown consistent earnings growth significantly impacts long-term equity performance.4,5 All of this demonstrates the value of strategies that rely on traditional fundamental stock analysis: assessing the strength of companies’ balance sheets, the quality of their management teams, evaluating their competitive advantages, projecting their earnings potential and determining if their current stock prices are expensive or cheap relative to those earnings forecasts.
Traditional approaches still provide the best potential for outperforming the broad market
Once you recognise the historical primacy of corporate earnings in driving long-term stock prices, the next question is: what is potentially the best way to identify companies with the strongest fundamentals and the greatest potential for outsized returns? We believe that objective can be achieved with a number of disciplined strategies. Look for “growth gaps” that occur when a company’s growth potential is not yet fully reflected in its price. Even sophisticated investors who focus on fundamentals—like many research analysts at major investment firms—often fail to look far enough into the future. Those with longer horizons, analysing companies’ earning potential not over just the next 12 months but over the next three to five years, can identify significant “growth gaps” between the consensus earnings estimates and the companies’ much longer-term growth potential. As Figure 2 illustrates, a company’s structural and sustainable competitive advantages, as well as its innovativeness, can deliver long-term gains that significantly overshoot consensus expectations.
Investors who focus on the fundamentals—with a rigorous process—have an opportunity to excel
Ultimately, sustained investment success hinges not on rapid reactions or chasing the crowded consensus, but rather on deliberate decisions grounded in deep analysis, judgment and patience. That seems to prove decisively that in investing, as in life, the race is won not by the swift, but by the steady.
In the investment race, the tortoise beats the hare
Algorithmic trading involves the use of computer programmes and algorithms to execute trading orders automatically based on predetermined criteria such as timing, price, or volume. This approach aims to optimise trading strategies, minimise costs, and manage risk more efficiently than manual trading. Passive Investing is an investment strategy that seeks to replicate the performance of a market index or benchmark, rather than actively selecting securities. Passive investing typically involves buying and holding diversified portfolios over the long term, with the goal of achieving steady returns and minimising transaction costs.
Sources:
Definitions:
“Research has shown that investors who are attuned to behavioural biases can better anticipate the times when excessive optimism or unjustified pessimism causes stock prices to become misaligned with underlying fundamentals”
Find companies with “economic moats” that allow them to sustain long-term competitive advantages. Determining which companies can deliver these growth gaps requires rigorous and robust analysis. We believe one way to narrow the search is to look for companies with advantages that effectively work like castle moats blocking access to intruders—the competitors who would like to steal some of their market share. These moats can take many forms. A company may have a nearly unbeatable brand that customers consistently prefer. It may have proprietary products or exclusive access to valuable resources. The firm may benefit from legacy regulatory approvals or licenses that are difficult for newcomers to obtain. Companies may also have a large operational scope and enjoy economies of scale that create a high barrier to entry for new firms because they can’t match that breadth or compete on costs. Research once again confirms the merits of this approach. It shows firms with significant competitive advantages tend to generate superior and more stable returns on capital, while also often beating consensus expectations of their earnings.6 Focus on earnings persistence. Looking at current earnings and near-term earnings projections alone is not enough. It is also important to assess whether a company will be able to increase its earnings over multiple years. A study demonstrated that companies with persistently growing earnings significantly outperform their peers, achieving annual returns approximately 7% higher.7 Analyse the accounting quality of earnings, emphasizing cash-based earnings over accrual-heavy accounting measures. A now famous study found that portfolios favouring firms with high cash-flow-to-earnings ratios consistently deliver abnormal returns of about 10% per year, far outperforming portfolios dominated by firms with high accruals (accounting entries such as increases in accounts receivable, inventory adjustments, depreciation or other non-cash measures) that can temporarily inflate reported earnings without reflecting sustainable cash generation.8 Use an awareness of investor biases to identify opportunities. As a wealth of behavioural finance studies have shown, market participants are prone to systematic and irrational biases—such as over-optimism, anchoring (clinging to past information and ignoring new insights) and herd behavior—that can distort stock prices and earnings expectations. Consensus forecasts are often based on such investor sentiment rather than pure rational analysis. Research has shown that investors who are attuned to behavioural biases can better anticipate—and better capitalise on—the times when excessive optimism or unjustified pessimism causes stock prices to become misaligned with underlying fundamentals.9 Another study found that some of these biases—including over-optimism and anchoring—are especially prevalent in growth sectors of the market, such as technology. Furthermore, that same research found investors who adjust for these biases have achieved excess returns of about 8% annually.10
Look for high-quality management teams whose incentives are aligned with shareholder interests. Renowned investor Warren Buffett is one of the biggest proponents of having executive compensation tied to long-term shareholder interests and not short-term measures, like the changes in company’s quarterly or annual stock price. Firms that focus on long-term value creation tend to generate more sustainable earnings growth and often surpass consensus expectations for extended periods. Select companies that make disciplined capital allocation decisions. Superior capital allocators—those who reinvest earnings in ways that deliver incremental returns or strategically repurchase undervalued shares of their own stock—create significant value for their shareholders over time. Again, studies prove it. Research shows capital allocation proficiency directly correlates with a company’s long-term financial performance and stock returns.11 Therefore, investors who can accurately assess the effectiveness of companies’ capital allocation decisions are more likely to outperform. Resist the temptations created by the short-term noise and don’t waver from a long-term commitment. The allure of the latest investment fad, a perceived opportunity to precisely time an economic cycle, or bet on the short-term direction of the market can be difficult to resist. Market noise, media narratives and daily performance all feed those temptations. Resisting those distractions requires exceptional discipline and emotional fortitude, particularly in the midst of volatile markets. Successful investing is as much about mastering oneself as it is about mastering the markets. But all the research cited here shows that sustaining a disciplined, long-term approach can result in significant outperformance.
5 years
10 months
Positive growth gap
Core-growth companies may have:
Structural benefits (such as favorable demographic trends, a unique distribution channel, or a regulatory advantage for a firm that is long-term incumbent in its industry) A sustainable competitive advantage (from a strong and customer preferred brand, dominant market share, proprietary technology or patents, as examples) or Industry-leading innovation (in products, services, processes or business model)
• • •
“For any active investor to outperform, another has to underperform. They are fighting amongst themselves”
The most popular argument used against active management, the so-called zero-sum game argument, is also the most abused, misused, and misunderstood. Not only that, our new research into changes both in the structure and participants in stock markets suggests that there may be greater opportunities for active managers to outperform in the future than in the past. This is true even in the most challenging of markets, the US.
It can be explained as follows. There are two types of investors who make up the market, active and passive. Passive investors earn the market return. It follows that active investors, in aggregate, must also earn the market return because, when you combine the two, they must equal the market. For any active investor to outperform, another has to underperform. They are fighting amongst themselves. And, because active managers charge higher fees than passive, active investors in aggregate have to underperform passive net of fees. The logic is sound, but how it is applied is where it often goes wrong.
What is the zero-sum game argument?
Another shift is the rise of the retail investor. Hastened by the move to commission-free trading at a number of large US brokers (often through apps), individual investor participation in the stock market has surged. This trend accelerated during Covid, when many people found themselves with more time and money on their hands. The GameStop saga brought discussions about trading and investing to the dinner table in many households. In 2023, the number of individuals with trading accounts at a peer group of four major brokers was more than double the number from 2016.
The already flawed assumption that equity markets present a ‘zero-sum game’, in which an active manager can’t beat passive strategies and can only win when others active managers lose, has become even less valid. The emergence of new investors has created more opportunities for active managers to outperform.
We could have made the arguments above at any time in history. But what has changed recently is the rise of investors who fall into this category of “active investors”, but who are not active equity fund managers. This is why we believe we can be more confident about the future prospects for active fund managers. Firstly, there has been a proliferation of ETFs in recent years that do not track the broad market. We are calling these “neo passives”. In the US alone, there are now over six times as many of these as traditional ETFs and inflows into these strategies have been 50% higher than traditional ETFs from the start of 2018 to the end of July 2024.
The breadth of positioning among the 10 ETFs with the highest 5-year flows is wide
While the number of monthly active users of the main broker apps has fallen from its Covid-peak, it remains more than 60% above the level of 2018. Unlike many other post-pandemic trends, interest among Americans in investing has endured. Of course, many of these individuals may just be buying S&P 500 ETFs, but the evidence suggests otherwise. Data from the Federal Reserve’s Survey of Consumer Finances shows that direct stock holdings as a share of total financial assets have increased close to levels not seen since the peak of the Dotcom bubble. This figure is directly held stocks only and does not include mutual funds or ETFs. This survey only takes place every three years, and we will need to wait until 2026 for the next set of results to be released. However, given enthusiasm for the US Magnificent-71, it is easy to imagine that this line will have moved higher still in the intervening years.
The first thing people often do is lump all passive investors on one side against active fund managers on the other. But the devil is in the detail. Technically, passive investors in the zero-sum game argument are those buying every stock in proportion to its market capitalisation weight. For example, if a stock is 5% of the market, it is 5% of your portfolio. In the zero-sum game argument, anyone who is not tracking the broad market in this way should go on the “active investor” side of the ledger. It should be immediately obvious that this is not just active fund managers. Examples who fall into this category include anyone making sector, style, country, sustainability/ESG-driven, thematic, or other equity allocation decisions. Buy a technology ETF? In the zero-sum game, you are an active investor. The building blocks may be passive, but you end up with a portfolio that diverges from broad market weights. It also includes retail investors picking individual stocks. Meme stocks were an extreme example, but the point applies more generally. In his original formulation of the zero-sum game argument, the famous academic William Sharpe (1991) himself states this explicitly: “Active managers may not fully represent the "non-passive" component of the market in question…It is, of course, possible for the average professionally or institutionally actively managed dollar to outperform the average passively managed dollar, after cost”. Another point worth noting is that the zero-sum game argument applies to the aggregate of all active investors. It does not mean that any subset of active investors, or even the average or median active investor, cannot outperform passive. None of this means that they will, of course. But it is not the mathematical impossibility that is often suggested.
What do people get wrong about the zero-sum game argument?
What’s changed: the emergence of “neo passive” investors
What’s changed: the return of private stock pickers
1. The Magnificent-7 is the name given to Nvidia, Meta Platforms (Facebook), Amazon, Apple, Alphabet (Google), Microsoft, and Tesla.
The number of private individual investors with investing accounts have soared
The other part of the zero-sum game argument that fails the “real world” test is the idea that any investor can truly be “passive” in the sense William Sharpe defines it. It simply isn’t possible to earn the market return by investing money in line with the weights of each stock in a given benchmark index, then going to sleep and letting the market do the rest. What about initial public offerings? Or promotions or demotions from one market to another, such as large cap versus small cap? Or other changes, such MSCI’s decision a few years ago to increase the proportion of the market capitalisation of Chinese “A-shares” included in its main benchmarks? All of these types of transactions create opportunities for a wealth transfer from passive investors to active. Active investors can trade in advance of index changes being implemented, then sell to passive investors when they become forced buyers. Index rebalancing leads to increased trading volumes and variability in the prices of affected stocks, popular for some active strategies to focus on. Active investors are also able to participate in IPOs, where passive typically do not, being forced to buy in the after-market. All trading incurs costs.
Other issues: transactions
Many critics of active fund management use the zero-sum game to argue that it is mathematically impossible for active fund managers to beat passive, net of fees. This article hopefully demonstrates to you that this is categorically false. Not only that. The rise in numbers of investors and value of investments that are not allocated according to broad market weights means we can be more optimistic about the future for active management than the past. It doesn’t mean that the average fund manager will go on to outperform, but it does mean you shouldn’t automatically assume they can’t or won’t. Now is the time to reconsider your beliefs about active and passive management, even in markets that you thought were “efficient”.
In summary
Endnote:
Jon Exley
Head of Specialist Solutions
Duncan Lamont, CFA
Head of Strategic Research
4
%
2
0
-2
-4
-6
-8
Apple Inc
Microsoft Corp
NVIDIA Corp
Amazon.com Inc
Meta Platforms Inc Class A
Alphabet Inc Class C
Broadcom Inc
Tesla Inc
Eli Lilly and Co
Berkshire Hathaway Inc Class B
Overweight
Underweight
Source: Morningstar, Schroders, as at 30 September 2024. Based on 10 neo passive ETFs with highest 5-year flows.
Broker peer group number of accounts (million)
100
80
60
40
20
2016
2017
2018
2019
2020
2021
2022
2023
Source: Fidelity, Schwab, Robinhood, TD Ameritrade Schroders, 31 December 2023. Peer group based on data from Schwab, Fidelity, Robinhood, and TD Ameritrade prior to its acquisition by Schwab.
Source: Morningstar, Schroders, as at 31 July 2024.
The share of flows into US-focussed neo passive ETFs has eclipsed classical ETFs
Source: Morningstar, Schroders, as at 31 July 2024. Cumulative flows since January 2004, US dollars.
The number of US-focused neo passive ETFs has soared in comparison to classical ETFs over the last 20 years
You can see the consequences by looking at how much these ETFs allocate to the largest stocks in the US market. The chart below shows this for the 10 neo passive US equity ETFs that have attracted the greatest inflows in the five years to 30 September 2024. These 10 ETFs make up about half of all inflows to neo passive ETFs over this period. Breadth of active positioning is wide. The largest overweight holding in Apple is just over +2%, and the largest underweight is -7% (some don’t hold Apple at all). Make no bones about it: the rise of neo passive strategies results in active stock selection decisions, whether consciously or not.