Navigating a higher-yield world
Bond investors' focus shifts to income stability, risk management amid diverging monetary policy
Latest insights
Artemis’s Liam O'Donnell says that while long-duration bonds have “rediscovered some of their poise”, he finds it difficult to look beyond the real yields being generated at the short end
Why I can’t take this leap of faith in the bond market
READ THE ARTICLE
Gilt market volatility isn’t all down to the ‘moron premium’
ARTEMIS
Fixed income’s resurgence: Why wealth managers should rethink allocations
PIMCO
Welcome to the fixed income café where lunch can be free
China’s growth engine faces fresh challenges
Previous insights
Reevaluating passive bond allocations – which have historically underperformed active strategies – may open the door to improved investment outcomes
Calculating the active advantage in fixed income
Artemis’s David Ennett reveals what questions investors should be asking to get the most out of the bond market this year
Three big questions for fixed income investors in 2026
PIMCO’s Tiffany Wilding and Andrew Balls say resilient, AI-fuelled growth is masking “K-shaped” divergence – strengthening the case for high-quality fixed income in 2026
Cyclical Outlook: Compounding opportunity
The Fed’s policy pivot highlights the tension between lingering inflation and buoyant markets, with bonds regaining their edge
Charting market views on interest rates
From central bank moves and shifting tariff dynamics to tech-driven productivity gains, the economic landscape is evolving fast. PIMCO’s latest Cyclical Outlook explores where risks are intensifying, where opportunities are emerging – and how to position portfolios for the volatile year ahead
Tariffs, technology and transition
As interest rates rise and volatility persists, Oaktree believe a broader, more dynamic credit landscape helps investors seek income, diversification, and stability in uncertain markets
Credit reimagined: Where income meets opportunity
Oaktree believes that high valuations and market divides are creating selective opportunities across credit
Three insights on today’s diverging markets
The US high-yield market may dwarf its European equivalent when it comes to size, but in terms of opportunities for active managers, it can’t compete
Why it’s not just golf where Europe has the edge over the US
Risk and leverage have migrated from corporates and consumers to governments, according to Stephen Snowden, Head of Fixed Income
Are governments riskier than companies?
RETURN TO HOMEPAGE
Important information FOR PROFESSIONAL INVESTORS AND/OR QUALIFIED INVESTORS AND/OR FINANCIAL INTERMEDIARIES ONLY. NOT FOR USE WITH OR BY PRIVATE INVESTORS. This is a marketing communication. Before making any final investment decisions, and to understand the investment risks involved, refer to the fund prospectus and KIID/KID, available in English and in your local language (depending on local country registration), from the relevant fund page or literature section on www.artemisfunds.com. The documents can also be found on www.fundinfo.com. CAPITAL AT RISK. All financial investments involve taking risk and the value of your investment may go down as well as up. This means your investment is not guaranteed and you may not get back as much as you put in. Any income from the investment is also likely to vary and cannot be guaranteed. Investment in a fund concerns the acquisition of units/shares in the fund and not in the underlying assets of the fund. The fund is a sub-fund of Artemis Investment Funds ICVC. For further information, visit www.artemisfunds.com/oeic. Any research and analysis in this communication has been obtained by Artemis for its own use. Although this communication is based on sources of information that Artemis believes to be reliable, no guarantee is given as to its accuracy or completeness. Reference to specific shares or companies should not be taken as advice or a recommendation to invest in them. Third parties (including FTSE and MSCI) whose data may be included in this document do not accept any liability for errors or omissions. For information, visit www.artemisfunds.com/third-party-data. Any forward-looking statements are based on Artemis’ current expectations and projections and are subject to change without notice. Issued by Artemis Fund Managers Ltd which is authorised and regulated by the Financial Conduct Authority.
Find out more about the Artemis Strategic Bond Fund
Sources 1. CNBC as at 2 Oct 2025. 2. Office for National Statistics, 17 Sep 2025. Consumer Prices Inflation (CPI) rose 3.8% over the 12 months to 31 Aug 2025. 3. Bloomberg as at 1 Sep 2025.
Leverage has moved from corporates and consumers to governments
Source: 1. Federal Reserve, Artemis as at 1 Jul 2024. 2. Bloomberg as at 31 Dec 2024. 3. Bloomberg, IMF, OBR. Actual data as at 31 December 2023. OBR forecasts as at 31 October 2024 for 2024 to 2028.
4.0%
3.5%
3.0%
2.5%
2.0%
1.5%
1.0%
0.5%
2010
2011
2012
2013
2014
2015
2016
2018
2020
2019
2021
2022
2023
2024
2017
Corporates
Government
US: interest as a % of GDP
1
14
13
12
11
10
9
8
7
6
5
1999
2001
2003
2005
2007
2009
Debt service ratio (%)
Household debt service ratios
US
Great Britain
Germany
2
140
130
120
110
100
90
80
70
60
50
40
2006
2008
2026
2028
Debt as % of GDP
Government debt/GDP
UK
3
The upshot of all this is that gilts are now attractively valued and their higher yields are attracting a lot of attention from retail investors. Indeed, popular investment platforms such as Hargreaves Lansdown, AJ Bell and interactive investor are reporting record demand for gilts. It’s not all that surprising. With inflation at 3.8% and 30-year gilts offering yields of 5.5%, it’s easy to see why gilts have such a strong appeal – and for direct investors those gains can be tax-free. Markets are currently pricing the Bank of England base rate to be around 3.6% by the middle of next year. Falling interest rates should be supportive for bond markets, especially at the long end of the curve, so there’s potential for some capital uplift too.
Pre-Budget jitters aside, I don’t wish to talk down the UK economy, which my colleagues and I believe is in reasonable shape. It’s the government with the debt problem, not the consumer. Overall, consumer savings are incredibly high and debt relatively low. Companies have also been deleveraging – paying down their debt and issuing bonds at a much shorter maturity than historically. In other words, consumers and companies appear to have much stronger balance sheets than governments.
This makes investment-grade corporate bonds comparatively more appealing than government debt, in my view. For corporate bonds, the technical backdrop looks strong, net issuance is falling, default rates are low and although current spread levels are historically tight, all-in yields remain attractive. History suggests that investors should make more money on corporate bonds than on gilts over the long term. The corporate bond journey is much more volatile, but these bonds generate more income – which can compound powerfully over time.
Debt: The risk migration
Savers’ ‘gilty’ pleasure
But before they pile in, we believe investors need to understand the risks of holding these gilts, including opportunity cost. That 5.25% doesn’t look so attractive if you’re starting to get anxious about the government’s ability to repay the loan. That’s why institutional bond buyers are now in the driving seat ahead of the Autumn Budget. They’re telling Rachel Reeves that they’ll expect a lot more reward for lending if she doesn’t find an effective way to mend the deficit. The capital value of existing bonds on the old terms may go down rather than up if the government is forced to issue new bonds at significantly higher rates.
Not so fast…
Would you rather lend money to Rachel Reeves and the UK government or to Tesco? And how long would you be comfortable lending them money for? Which is most likely to pay it back? There was a time when most people would have replied that G7 governments are much safer than companies. If nothing else, you know the government will still be there in 10 or 30 years’ time to pay back its debt. But the answer is not so cut and dry anymore. Government bond markets have been volatile of late, colossal budgetary deficits are piling on pressure further down the yield curve and political upheaval is rife. At the time of writing, the US government is in shutdown, while France is in political limbo following a vote of no confidence against previous prime minister François Bayrou. Here in the UK, the upcoming Budget on 26 November is creating massive uncertainty and the government has backed itself into a corner of its own making with its fiscal rules. Don’t get me wrong, I believe all three governments – and Tesco – will still be operating in 30 years’ time but you only have to look at long-dated bond yields to see that the market wants a higher level of compensation for the elevated risk of lending to governments at present.
In most developed economies, fiscal looseness has been the theme of this year, with the UK the only economy to attempt prudence. But this has not resulted in UK outperformance at the long end. Quite the opposite: 30-year bond yields continued to climb to their highest levels since 1998. The bond market has judged the UK government’s plan to tackle the budget deficit as lacking in credibility – although to put this into context, the recent sell-off wasn’t much worse than for German or US bonds. Even so, fiscal sustainability remains a concern for the UK. One reason 30-year gilts are yielding over 5.5% – levels not seen since the late 1990s – is unquestionably down to a government that has made mistakes. But there are other contributing factors at play, such as inflation coming down more slowly than expected and the Bank of England becoming more hawkish as a result. There is also less of a natural buyer base for long-dated gilts as more pension funds go to buy-out, just as supply has picked up. The Bank of England continues its quantitative tightening programme, which is adding to the pressure. This isn’t all down to the ‘moron premium’.
There is, however, another driver of returns that is often overlooked: adding ‘specific risk’ via stock selection. Using detailed credit analysis to identify the most attractive assets in each pocket of the bond market can dramatically enhance the returns from making the right calls on duration and credit beta. Adding specific risk can mean that you don’t have to take as much outright duration or beta risk in portfolios to achieve the returns you’re looking for. Let’s look at a worked example. Assuming that, last November, you shared our belief that rate cuts were coming, how would you have looked to reflect that view in your portfolio?
“Companies have also been deleveraging – paying down their debt and issuing bonds at a much shorter maturity than historically. In other words, consumers and companies appear to have much stronger balance sheets than governments”
Stephen Snowden, head of fixed income
“One reason 30-year gilts are yielding over 5.5% – levels not seen since the late 1990s – is unquestionably down to a government that has made mistakes”
Stephen Snowden head of fixed income
CONTRIBUTOR
Risk and leverage have migrated from corporates and consumers to governments, according to Stephen Snowden, Head of Fixed Income at Artemis
Important information FOR PROFESSIONAL INVESTORS AND/OR QUALIFIED INVESTORS AND/OR FINANCIAL INTERMEDIARIES ONLY. NOT FOR USE WITH OR BY PRIVATE INVESTORS. This is a marketing communication. Before making any final investment decisions, and to understand the investment risks involved, refer to the fund prospectus and KIID/KID, available in English and in your local language (depending on local country registration), from the relevant fund page or literature section on www.artemisfunds.com. The documents can also be found on www.fundinfo.com. CAPITAL AT RISK. All financial investments involve taking risk and the value of your investment may go down as well as up. This means your investment is not guaranteed and you may not get back as much as you put in. Any income from the investment is also likely to vary and cannot be guaranteed. The fund is a sub-fund of Artemis Funds (Lux). For further information, visit www.artemisfunds.com/sicav. Any research and analysis in this communication has been obtained by Artemis for its own use. Although this communication is based on sources of information that Artemis believes to be reliable, no guarantee is given as to its accuracy or completeness. Third parties (including FTSE and MSCI) whose data may be included in this document do not accept any liability for errors or omissions. For information, visit www.artemisfunds.com/third-party-data. Any forward-looking statements are based on Artemis’ current expectations and projections and are subject to change without notice. Issued by: Artemis Investment Management LLP which is authorised and regulated by the UK Financial Conduct Authority; in Germany, AI Management (Europe) GmbH; in Switzerland, Artemis Investment Services (Switzerland) GmbH.
Find out more about the Artemis Short-Dated Global High Yield Bond Fund
A European short-dated focus strategy has to buy almost 50% of the total issuers
Source: Morningstar and ICE BofA indices at 31 August 2025
Taking the example of our short-dated strategy, we believe that 100 securities is a reasonable level to get the ‘free lunch’ of adequate diversification. Most of our peers seem to believe that an efficient number of holdings is around 300 (the average is 334) . There are only 247 issuers in European high yield that have bonds with a maturity of less than 5.5 years . This probably overstates matters, as a lot of these will be illiquid or will have longer legal final maturities (for example subordinated financials).
But if we take it at face value, it means that any ‘focused’ strategy will need to buy half the issuers in existence if they exclusively focus on European high yield. The average ‘active’ high yield strategy in Europe effectively needs to buy more than the entire market of issuers. So – we like European high yield a lot because it is inefficient. But our strategy allows us to focus on finding a small subset of the most attractive bonds within this market, rather than simply buying the whole market (and effectively writing off any ability to select mispriced securities).
There is another reason why we don’t focus exclusively on Europe which has nothing to do with its advantages or disadvantages over the US, or any other market for that matter. If you focus on a single region, as 90% of high-yield funds do, you are ignoring a peculiar trait in which an international company can issue two bonds with the same maturity and from the same part of the capital structure, but that offer different yields depending upon which country they are issued in. Taking advantage of this quirk doesn’t involve taking a view on currencies – we simply hedge this risk. But even after this hedge is applied, it has been possible to earn up to 3 percentage points more over the past few years by lending to certain companies in euros rather than dollars (and vice versa)
This relationship isn’t consistent as the prices of euro/dollar bonds are volatile. But the small size of our funds and relative freedom compared with more benchmark-driven approaches let us flip between the two whenever relative valuations suit. It also shows that simple top-down allocation between different currencies won’t capture these opportunities – these only come about through bottom-up analysis. There are a number of terms that apply to both golf and bonds: hybrid, carry and recovery are commonly used in both the sport and the asset class. Well, here’s another: like a short putt that can be counted without the ball being played, we regard being able to pick up a higher yield with an identical risk as something of a gimme.
Taking advantage of regional discrepancies
The primary reason is that the European high-yield market is less efficient than its US counterpart. Not only is it smaller, it also has a more idiosyncratic group of issuers and fewer structural owners. As such, we see more mispriced securities than in the US – in terms of bonds that are both too cheap and too expensive. Given we focus on bottom-up stockpicking to jump on credit inefficiencies, it makes sense for us to allocate more capital to a market where they are more prevalent. So why don’t we just ignore the US completely? And why should a client buy our fund rather than an exclusive European high-yield one with the same bottom-up focus? The simple answer relates to concentration.
European high yield is less efficient
Sources 1. Morningstar and ICE BofA indices at 31 August 2025. 2. Morningstar and ICE BofA indices at 31 August 2025.
Not enough bonds to go around
Europe narrowly defeated the US in the Ryder Cup in September, picking up the trophy despite a spirited final-day comeback from the Americans. But golf isn’t the only area where Europe has the edge over the US – we think it is a better bet for active high-yield bond investors, too. At €600bn, the European high-yield bond market is about one-third of the size of its US equivalent and makes up just 20% of the global index. Yet it accounts for about half of our short-dated and all-maturity global high-yield funds, with this larger weighting a common thread in our portfolios over the six years we have managed money at Artemis. So why is this?
“The European high-yield bond market is about one-third of the size of its US equivalent and makes up just 20% of the global index. Yet it accounts for about half of our short-dated and all-maturity global high-yield funds”
Jack Holmes, fund manager
Our strategy allows us to focus on finding a small subset of the most attractive bonds within this market, rather than simply buying the whole market (and effectively writing off any ability to select mispriced securities)
Jack Holmes fund manager
Past performance is not a guarantee or a reliable indicator of future results. This material contains the current opinions of the author and such opinions are subject to change without notice. This material is distributed for informational purposes only and should not be considered as investment advice or a recommendation of any particular security, strategy or investment product. Information contained herein has been obtained from sources believed to be reliable, but not guaranteed. PIMCO as a general matter provides services to qualified institutions, financial intermediaries and institutional investors. Individual investors should contact their own financial professional to determine the most appropriate investment options for their financial situation. This is not an offer to any person in any jurisdiction where unlawful or unauthorized. | Pacific Investment Management Company LLC, 650 Newport Center Drive, Newport Beach, CA 92660 is regulated by the United States Securities and Exchange Commission. PIMCO Europe Ltd (Company No. 2604517, 11 Baker Street, London W1U 3AH, United Kingdom) is authorised and regulated by the Financial Conduct Authority (FCA) (12 Endeavour Square, London E20 1JN) in the UK. The services provided by PIMCO Europe Ltd are not available to retail investors, who should not rely on this communication but contact their financial adviser. Since PIMCO Europe Ltd services and products are provided exclusively to professional clients, the appropriateness of such is always affirmed. Forecasts, estimates and certain information contained herein are based upon proprietary research and should not be interpreted as investment advice, as an offer or solicitation, nor as the purchase or sale of any financial instrument. Forecasts and estimates have certain inherent limitations, and unlike an actual performance record, do not reflect actual trading, liquidity constraints, fees, and/or other costs. In addition, references to future results should not be construed as an estimate or promise of results that a client portfolio may achieve. Statements concerning financial market trends or portfolio strategies are based on current market conditions, which will fluctuate. There is no guarantee that these investment strategies will work under all market conditions or are appropriate for all investors and each investor should evaluate their ability to invest for the long term, especially during periods of downturn in the market. Investors should consult their investment professional prior to making an investment decision. Outlook and strategies are subject to change without notice. Correlation is a statistical measure of how two securities move in relation to each other. Duration is the measure of a bond's price sensitivity to interest rates and is expressed in years. For professional use only Per the information available to us you fulfill the requirements to be classified as professional clients as defined in the MiFiD II Directive 2014/65/EU Annex II Handbook. Please inform us if otherwise. The services and products described in this communication are only available to professional clients as defined in the MiFiD II Directive 2014/65/EU Annex II Handbook and its implementation of local rules and as defined in the Financial Conduct Authority's Handbook. This communication is not a public offer and individual investors should not rely on this document. Opinion and estimates offered constitute our judgment and are subject to change without notice, as are statements of financial market trends, which are based on current market conditions. We believe the information provided here is reliable, but do not warrant its accuracy or completeness. This material contains the opinions of the manager and such opinions are subject to change without notice. This material has been distributed for informational purposes only and should not be considered as investment advice or a recommendation of any particular security, strategy or investment product. Information contained herein has been obtained from sources believed to be reliable, but not guaranteed. No part of this material may be reproduced in any form, or referred to in any other publication, without express written permission. PIMCO is a trademark of Allianz Asset Management of America LLC in the United States and throughout the world. No part of this publication may be reproduced in any form, or referred to in any other publication, without express written permission. PIMCO is a trademark of Allianz Asset Management of America LLC in the United States and throughout the world. ©2025, PIMCO.
Explore the full PIMCO Cyclical Outlook
Gain deeper insights into how shifting global forces – from tariff impacts to the ongoing AI investment boom – may shape growth, inflation, and investment opportunities in the months ahead.
The Trump administration aims to reshape the US’s global role while improving the country’s trade balance. In previous Cyclical Outlooks, we argued that addressing these imbalances would require difficult-to-implement reforms in both the US and its trading partners. Since our last Cyclical Forum in March , the administration has enacted sweeping overhauls. The impact on the trade balance remains uncertain. However, we believe three forces – tariff effects, the technology investment boom, and challenges to institutions – will likely drive greater economic and capital market volatility within the US and globally.
Clashing forces create winners and losers: A growing tension among three macro forces – trade frictions, the AI investment boom, and challenges to institutions including the Federal Reserve – could test conventional economic and investment frameworks, drive volatility, and widen the gap between winners and losers, both in the US and globally. Delayed tariff effects begin to bite: Economic growth has been surprisingly resilient, but that appears likely to change. After preemptive actions boosted global trade flows and goods production, many countries now face a transition, with mounting pressure from tariffs and constrained fiscal flexibility. In the US, we believe the main risk from tariffs isn’t a price adjustment – it’s that unemployment could rise. The Fed and other central banks have ample room for more interest rate cuts. Tech investment provides support amid signs of weakness: Global data trends point to a weaker period ahead before targeted fiscal stimulus in some regions starts to kick in. At the same time, resilient tech investment, especially in the US and China, is poised to continue, with potentially growing effects on productivity and the labor market.
Footnote 1. About PIMCO Cyclical Forum: PIMCO's quarterly Cyclical Forum gives us an opportunity to come together amid the short-term noise to discuss the structural forces shaping the global economy and financial markets over the next year.
Economic outlook: A clash of forces tests conventional frameworks
Economic outlook: Key takeaways
Bond yields offer durable opportunities, while cash rates are poised to decline: Locking in today’s attractive starting bond yields can support strong returns and income potential in the years ahead across a variety of economic scenarios. With rates on cash-like investments likely to decline alongside central bank policy rates, we expect bonds to outperform. We favor short and intermediate bond maturities. Global diversification can enhance outperformance potential: Investors can take advantage of today’s unusual abundance of global fixed income opportunities, with attractive real and nominal yields available in a variety of countries. Diversification across regions and currencies is an effective way to fortify portfolios and harvest sources of return. Relative value can be a guide across the public–private credit continuum: The conventional divide between public and private credit is giving way to a more integrated view. We see a continuum of opportunity spanning across these markets that should be evaluated on differences in liquidity and economic sensitivity. We focus on high quality assets and see strong return potential in asset-based finance. Together, these strategies – bond yield capture, global diversification, and credit continuum analysis – can form a robust investment framework.
Investment outlook: Key takeaways
“Global growth will likely slow during the remainder of 2025 as tariff-related effects take hold”
Tiffany Wilding, Economist, PIMCO
Andrew Balls, CIO Global Fixed Income, PIMCO
“Investors can take advantage of today’s unusually attractive array of global opportunities”
Tiffany Wilding Economist, PIMCO
Andrew Balls CIO Global Fixed Income, PIMCO
CONTRIBUTORS
Past performance is not a guarantee or a reliable indicator of future results. Investing in the bond market is subject to risks, including market, interest rate, issuer, credit, inflation risk, and liquidity risk. The value of most bonds and bond strategies are impacted by changes in interest rates. Bonds and bond strategies with longer durations tend to be more sensitive and volatile than those with shorter durations; bond prices generally fall as interest rates rise, and low interest rate environments increase this risk. Reductions in bond counterparty capacity may contribute to decreased market liquidity and increased price volatility. Bond investments may be worth more or less than the original cost when redeemed. Commodities contain heightened risk, including market, political, regulatory and natural conditions, and may not be appropriate for all investors. Statements concerning financial market trends or portfolio strategies are based on current market conditions, which will fluctuate. There is no guarantee that these investment strategies will work under all market conditions or are appropriate for all investors and each investor should evaluate their ability to invest for the long term, especially during periods of downturn in the market. Outlook and strategies are subject to change without notice. Performance results for certain charts and graphs may be limited by date ranges specified on those charts and graphs; different time periods may produce different results. It is not possible to invest directly in an unmanaged index. CPI, or Consumer Price Index, measures the average change over time in the prices paid by urban consumers for a market basket of consumer goods and services. The S&P Hopes and Dreams Index, calculated by Cameron Crise from Bloomberg, tracks the remaining percentage of market value unexplained by the book value and the net present value of the next three years of earnings estimates for the companies. The J.P. Morgan Hawk-Dove score assesses central bank communications to estimate monetary policy tendencies. The nominal neutral rate (often called r* or r-star) is an estimate of an interest rate that neither stimulates nor hinders economic growth. The Yield-to-Worst on the Bloomberg U.S. Aggregate Index represents the lowest potential yield an investor could receive on a bond from the index, without the bond defaulting. The 10-year U.S. Treasury inflation-indexed yield is a daily rate representing the real yield on Treasury Inflation-Protected Securities (TIPS) with a 10-year maturity. The 10-year German Bund inflation-indexed yield represents the real yield of Inflation-linked Federal bonds (ILB) with a 10-year maturity. This material contains the opinions of the manager, and such opinions are subject to change without notice. This material has been distributed for informational purposes only and should not be considered as investment advice or a recommendation of any particular security, strategy or investment product. Information contained herein has been obtained from sources believed to be reliable, but not guaranteed. No part of this material may be reproduced in any form, or referred to in any other publication, without express written permission. PIMCO Europe Ltd (Company No. 2604517, 11 Baker Street, London W1U 3AH, United Kingdom) is authorised and regulated by the Financial Conduct Authority (FCA) (12 Endeavour Square, London E20 1JN) in the UK. The services provided by PIMCO Europe Ltd are not available to retail investors, who should not rely on this communication but contact their financial adviser. Since PIMCO Europe Ltd services and products are provided exclusively to professional clients, the appropriateness of such is always affirmed. PIMCO is a trademark of Allianz Asset Management of America LLC in the United States and throughout the world. ©2025 PIMCO Europe Limited. All Rights Reserved.
Read more insights from PIMCO
The balance of risks to the Federal Reserve’s dual mandate (price stability and maximum employment) prompted the central bank to lower its policy rate in September in an effort to bolster the economy and employment. However, US inflation remains above the Fed’s target and is elevated relative to global peers.
We expect additional rate cuts, but not down to the near-zero levels that could rekindle high inflation. Well-anchored inflation expectations likely inform Fed decisions at least as much as current prices and recent trends do. Thus far, tariff-related price pressures do not appear to have significantly affected inflation expectations.
Monetary policy walks the inflation tightrope
Indeed, the US equity market has remained both buoyant and bullish, but how much of this is froth? Investors are getting little additional earnings yield by owning equities, versus what they would earn owning a nominal 10-year Treasury note. This suggests that bonds may offer better risk-adjusted returns in the current environment.
Bullish sentiment has returned to equity markets after a tariff-related dip: Stock prices don’t signal recession, but how much of this is froth?
But while stock markets appear optimistic and inflation expectations seem stable for now, higher policy uncertainty has kept yields on 10-year Treasuries elevated. The difference between 10-year US Treasury yields and the nominal neutral rate has risen above the levels signaled in Fed communications. This gap suggests the market is pricing in more risk for the long term. This could put upward pressure on long-term interest rates. It also signals elevated uncertainty about future inflation and growth.
Market pricing reflects expectations for long-term uncertainty
In late 2024, the Bloomberg US Aggregate Bond Index yield rose above the Fed’s policy rate for the first time in more than a year and has stayed there – emphasizing the compelling starting point for bonds now. It was extraordinary to have a benchmark bond yield running below – sometimes well below – the policy rate. Prior to the pandemic, this had happened only four times in this century. Fixed income offers an attractive opportunity with high starting yields. Historically, bonds have performed well across a range of different rate-cutting scenarios, and downward moves in bond yields have tended to follow cuts in the Fed policy rate.
A long-term trend has reasserted itself: Benchmark US bond index yield exceeds the Fed policy rate
Looking beyond the US, another long-term trend has returned during the post-pandemic recovery period: The yield on German 10-year inflation-indexed Bunds (or “linkers”) has remained in positive territory for nearly two years, after more than a decade below zero. Linker yields still significantly lag the inflation-indexed yield on US Treasury Inflation-Protected Securities (TIPS). TIPS yields have been hovering around 2% since 2023, but previously had been lower – even negative – in the low-inflation environment that followed the global financial crisis. Higher inflation-indexed yields are another signal that fixed income may be an attractive, risk-aware investment in today’s uncertain macroeconomic environment.
Market signals in German and U.S. inflation-linked bonds
Source: Haver Analytics and PIMCO calculations as of August 2025. For the 25th–75th percentile, the Consumer Price Index (CPI) was used for Australia, Canada, Japan, U.S., China, India, Brazil, South Korea, Mexico, Indonesia, Israel, Turkey, Russia, Egypt, Poland, Philippines, Vietnam, Colombia, Hungary, South Africa, and Thailand. The Harmonized Index of Consumer Prices (HICP) was used for Ireland, Germany, France, Belgium, Finland, Italy, Netherlands, Greece, Norway, Portugal, Spain, Sweden, Switzerland, U.K., and the euro area.
9%
8%
7%
6%
5%
4%
3%
2%
1%
0%
2025
U.S.
Global median
Euro area
Global 25th–75th percentile
Global core CPI inflation
Source: Bloomberg data and PIMCO calculations as of August 2025. Equity earnings yield is 1-year forward earnings divided by the price of the SPX index. Past performance is not a guarantee or a reliable indicator of future results.
9.0%
7.0%
5.0%
-1.0%
-3.0%
1997
1998
2000
2002
2004
Equity earnings yield less 10-year treasury yield
Source: Bloomberg data and PIMCO calculations as of August 2025. The Hawk-Dove score assesses central bank communications to estimate monetary policy tendencies. The nominal neutral rate (often called r* or r-star) is an estimate of an interest rate that neither stimulates nor hinders economic growth. The nominal rate is calculated using the Laubach Williams measure. Past performance is not a guarantee or a reliable indicator of future results.
30
25
20
15
0
-5
-10
-1
-2
-3
-4
Hawk-Dove score (LHS)
10-year Treasury yield – nominal neutral rate% (RHS)
Fedspeak vs. the gap between 10-year US Treasuries and the neutral rate
Hawk-Dove score
%
Hawkish
Dovish
Source: U.S. Federal Reserve and Bloomberg as of September 2025. Yield-to-worst is the estimated lowest potential yield that can be received on a bond without the issuer actually defaulting. Past performance is not a guarantee or a reliable indicator of future results.
4
1990
1995
Yield-to-worst on Bloomberg US Aggregate
Federal funds rate
Yield-to-worst on the Bloomberg US Aggregate Bond Index versus the fed funds rate
“Tariff-related price pressures do not appear to have significantly affected inflation expectations”
“While stock markets appear optimistic and inflation expectations seem stable for now, higher policy uncertainty has kept yields on 10-year Treasuries elevated”
Richard Clarida Former Federal Reserve Vice Chair, Global Economic Advisor, PIMCO
Important information FOR PROFESSIONAL INVESTORS AND/OR QUALIFIED INVESTORS AND/OR FINANCIAL INTERMEDIARIES ONLY. NOT FOR USE WITH OR BY PRIVATE INVESTORS. This is a marketing communication. Before making any final investment decisions, and to understand the investment risks involved, refer to the fund prospectus and KIID/KID, available in English and in your local language (depending on local country registration), from the relevant fund page or literature section on www.artemisfunds.com. The documents can also be found on www.fundinfo.com. CAPITAL AT RISK. All financial investments involve taking risk and the value of your investment may go down as well as up. This means your investment is not guaranteed and you may not get back as much as you put in. Any income from the investment is also likely to vary and cannot be guaranteed. Investment in a fund concerns the acquisition of units/shares in the fund and not in the underlying assets of the fund. Third parties (including FTSE and MSCI) whose data may be included in this document do not accept any liability for errors or omissions. For information, visit www.artemisfunds.com/third-party-data. Any research and analysis in this communication has been obtained by Artemis for its own use. Although this communication is based on sources of information that Artemis believes to be reliable, no guarantee is given as to its accuracy or completeness. Any forward-looking statements are based on Artemis’ current expectations and projections and are subject to change without notice. The fund is an authorised unit trust scheme. For further information, visit www.artemisfunds.com/unittrusts. Issued by Artemis Fund Managers Ltd which is authorised and regulated by the Financial Conduct Authority.
Find out more about Artemis' Fixed Income capabilities
Sources 1. Source: CNBC, 30-year gilt yields hit 5.69% on 2 September 2025 2. Source: www.telegraph.co.uk 3. Source: Artemis, 9 October 2025
In other words, it looks like the world has settled into a higher inflation regime, which ultimately means the interest rate cutting cycle has not got much further to run. Fiscal policy levers are turning in response to increased geopolitical threats and tariff shocks, as governments rush to insulate domestic demand. This should exert further upward pressure on prices. In a higher-for-longer environment, the light at the end of the tunnel consists of elevated coupons. Investors are now being compensated with decent real yields. For long-dated gilts, where a double helping of worry is already in the price, the valuation light is starting to flash. We view the gilt market as brutally cheap, although it could always become even cheaper. Meanwhile, another prominent politician – this time from across the Atlantic – has a track record of spooking markets and driving up risk premia. Donald Trump in his second term is proving to be even more unpredictable and bold in policy announcements than during his first and global leaders are turning to more extraordinary actions (think Germany’s fiscal package or Canadian protectionism) to grab a foothold in the new world order. The geopolitical/fiscal landscape has rarely been in such a state of flux. How are we, as investors, meant to position our portfolios in such circumstances? One thing we have been doing in our Artemis Strategic Bond Fund, within its corporate bond allocation, is de-risking. We want to free up firepower to take advantage of any spread decompression, should risk markets wobble into year-end. It’s difficult to pinpoint a specific catalyst for such an event, however given the multitude of risks and geopolitical uncertainty, a more prudent approach feels appropriate.
Since Liz Truss and Kwasi Kwarteng’s disastrous mini budget sent a wrecking ball through the gilt market in September 2022, the ‘moron premium’ has entered common parlance, at least within financial circles. The phrase, which refers to sovereign debt yields rising because of politicians’ mistakes, was brought out of retirement and dusted off when 30-year gilt yields spiked in August and September 2025, peaking around 5.7% . ‘Borrowing costs surge as Britain faces ‘moron premium’ under Reeves’, proclaimed The Telegraph in late August . While this sounds harsh, I would acknowledge that the UK government has made mistakes, some of which are reflected in high gilt yields. The chancellor’s ill-advised fiscal rules have robbed her of flexibility, especially when married to a cast-iron guarantee that there will be no increases in income tax, employee national insurance or VAT. She is rummaging down the back of the sofa for a billion here and a billion there, publicly road-testing various tax hikes from stamp duty to bank windfall taxes. Irrespective of your politics, the market doesn’t believe the numbers add up.
But that is far from the whole story. Many other contributing factors explain why 30-year gilt yields are where they are, including the erosion of their natural buyer base as more pension funds go to buyout. This isn’t all down to the ‘moron premium’. What causes market shocks is unknown information, whereas everybody knows we have an unpopular government with low approval ratings. The main reason gilts sold off this summer was, in my view, a more hawkish tone at the Bank of England. Although the Monetary Policy Committee cut rates by a quarter point on 6 August, it needed two rounds of voting to push the cut through, which the market decided does not bode well. The Bank of England’s quantitative tightening programme is adding to the pressure.
Bond yields are essentially an expression of where interest rates will average out over the long term, which is largely a function of where inflation will settle. Inflation has been sticky because wage growth has been persistently high, and although inflation is currently falling, it appears to be doing so more slowly than people had hoped. This means interest rates will come down at a slower pace and consequently, bond yields could go up a bit further (pushing valuations down). What’s more, the recent gilt sell-off was not an isolated incident and needs to be put into a global context. Yield curves around the world steepened this summer and in fact, the US and Germany experienced more aggressive steepening in August than the UK. Britain isn’t the only developed nation running a large budget deficit and issuing lots of bonds. Nor is it the only country grappling with sticky inflation. Global headline inflation across G10 regions (the US, EU, UK, Canada, Australia, New Zealand, Switzerland, Norway, Sweden and Japan) moved above 2% in April 2021 and peaked back in October 2022. Although considerable progress has been made, it still hasn’t returned to target and the post-Covid higher inflation period has now stretched to four and a half years. This has obviously had significant consequences for consumer behaviour and wage demands and it will continue to impact price setting in the future.
“The geopolitical/fiscal landscape has rarely been in such a state of flux. How are we, as investors, meant to position our portfolios in such circumstances?”
“The recent gilt sell-off was not an isolated incident and needs to be put into a global context”
This time, politicians’ mistakes are not solely to blame for pushing up gilt yields, argues Artemis’ Head of Fixed Income, Stephen Snowden
FOR PROFESSIONAL INVESTORS AND/OR QUALIFIED INVESTORS AND/OR FINANCIAL INTERMEDIARIES ONLY. NOT FOR USE WITH OR BY PRIVATE INVESTORS. This is a marketing communication. Before making any final investment decisions, and to understand the investment risks involved, refer to the fund prospectus and KIID/KID, available in English and in your local language (depending on local country registration), from the relevant fund page or literature section on www.artemisfunds.com. The documents can also be found on www.fundinfo.com. CAPITAL AT RISK. All financial investments involve taking risk and the value of your investment may go down as well as up. This means your investment is not guaranteed and you may not get back as much as you put in. Any income from the investment is also likely to vary and cannot be guaranteed. Investment in a fund concerns the acquisition of units/shares in the fund and not in the underlying assets of the fund. The fund is a sub-fund of Artemis Investment Funds ICVC. For further information, visit www.artemisfunds.com/oeic. Any research and analysis in this communication has been obtained by Artemis for its own use. Although this communication is based on sources of information that Artemis believes to be reliable, no guarantee is given as to its accuracy or completeness. Reference to specific shares or companies should not be taken as advice or a recommendation to invest in them. Third parties (including FTSE and MSCI) whose data may be included in this document do not accept any liability for errors or omissions. For information, visit www.artemisfunds.com/third-party-data. Any forward-looking statements are based on Artemis’ current expectations and projections and are subject to change without notice. Issued by Artemis Fund Managers Ltd which is authorised and regulated by the Financial Conduct Authority.
Find out more about the Artemis Corporate Bond Fund
So, where do we find them?
1. The new issue market An example of a free lunch everyone can swallow comes from the new issue market. Companies typically issue new bonds at a discount to outstanding debt to entice investors. Fund managers can buy them and very quickly make a very small profit. 2. Currency differences The vast majority of corporate bond trading is done over the counter - you can’t just push a button and execute a bond trade. As a result, bonds don’t always behave rationally. Large corporations often issue multiple bonds in different currencies and with varying levels of seniority and maturity, so the bond market is much more fragmented than the equity market. Bonds issued by the same company – that should theoretically trade at similar levels because they have similar risks – sometimes diverge. These opportunities appear frequently but to really take advantage of them there are a few ingredients that you need: a tight, focused portfolio, an efficient investment process and a nimble team.
3. Studying the small print A less exciting but often just as rewarding free lunch can come from reading the terms and conditions (T&Cs) of a bond issue carefully. Many bond prospectuses have slightly different T&Cs within them, which render some more attractive than others and this is not always reflected in the market. An example is L&G, which had several Tier 2 bonds with varying T&Cs. In one, the 2064 Tier 2 bond, the prospectus contained a specific clause stipulating that if regulatory changes meant it was no longer eligible for Tier 2 capital, L&G could call it back at par. In 2022 as part of a broad fixed income sell-off, this bond fell from a cash price of £130 to £70, leading to meaningful upside as the aforementioned regulatory changes were announced and the bond steadily climbed back to £100. L&G recently tendered for this bond at £100.
4. When Takeovers impact bond ratings Another free lunch occurs when a high-quality company buys a lower rated company. When the merger is complete, the weaker company should get a rating upgrade. Japanese insurer Nippon Life acquiring Resolution Life is a case in point. We bought Resolution Life bonds on the expectation that they would converge with Nippon Life’s bonds and that is exactly what we have seen, resulting in strong outperformance. Whilst ‘free lunches’ are plentiful in fixed income, they are not unlimited. Our efficient investment process means we can take advantage of these opportunities more quickly than some of our larger peers. Having a relatively concentrated portfolio also means these bottom-up opportunities make a meaningful contribution to our performance, so we do not have to rely on taking duration risk or other big macro calls. We prefer to take advantage of idiosyncratic free lunches instead.
It’s an old adage that there’s no such thing as a free lunch – somewhere down the line there’s a payment to be made. Except perhaps in the world of fixed income. The challenge is to spot the fixed income free lunches available for everyone plus those which not just anyone can snaffle – unless they are active, nimble and focused investors. It is the inherently inefficient nature of bond markets that we think potentially provides the most attractive free lunches, which we as bond managers find so appetizing.
WATCH: Grace Le on corporate bond currencies (01:28)
“The challenge is to spot the fixed income free lunches available for everyone plus those which not just anyone can snaffle – unless they are active, nimble and focused investors”
Grace Le, co-manager, Artemis Corporate Bond Fund
“Our efficient investment process means we can take advantage of opportunities more quickly than some of our larger peers”
Grace Le co-manager, Artemis Corporate Bond Fund
Diversification is supposed to be the only free lunch in investing, but corporate bond investors can find many more – if they know where to look. Grace Le, co-manager of the Artemis Corporate Bond Fund, explains
All investments contain risk and may lose value. Past performance does not predict future returns. This material contains the current opinions of the manager and such opinions are subject to change without notice. This material is distributed for informational purposes only and should not be considered as investment advice or a recommendation of any particular security, strategy or investment product. Information contained herein has been obtained from sources believed to be reliable, but not guaranteed. No part of this material may be reproduced in any form, or referred to in any other publication, without express written permission. PIMCO Europe Ltd (Company No. 2604517, 11 Baker Street, London W1U 3AH, United Kingdom) is authorised and regulated by the Financial Conduct Authority (FCA) (12 Endeavour Square, London E20 1JN) in the UK. The services provided by PIMCO Europe Ltd are not available to retail investors, who should not rely on this communication but contact their financial adviser. Since PIMCO Europe Ltd services and products are provided exclusively to professional clients, the appropriateness of such is always affirmed. PIMCO is a trademark of Allianz Asset Management of America LLC in the United States and throughout the world. ©2025 PIMCO
With interest rates now on a downward trend, fiscal pressures constraining governments, and regulators pushing for more robust retirement income solutions, fixed income is firmly back in the spotlight. Yields are higher, valuations more attractive, and the range of investable opportunities far broader than many wealth managers and advisers may have historically considered. For those who have long treated bonds as the “defensive ballast” in multi-asset portfolios, today’s market environment demands a fresh look.
The UK economy, according to Harrison, encapsulates the challenges facing developed markets globally, noting slowing growth, high debt and political headwinds. That debt dynamic is crucial. After years of crisis-driven spending, from the Global Financial Crisis to the pandemic and the energy shock, government balance sheets are stretched. Fiscal credibility now hinges on tough decisions. “The government is bumping right up against its fiscal rules,” says Harrison. “It’s possible taxes will rise in November’s budget.” For investors, the implications are twofold. On the one hand, fiscal tightening will weigh on growth. On the other, it will leave the Bank of England carrying the burden of supporting the economy through further rate cuts. Markets currently expect the Bank to stop easing at around 3.5%, but PIMCO’s view is more dovish. “We expect it to go lower than that, perhaps even below 3%,” Harrison says. No longer simply a “safe but unrewarding” option, Harrison believes gilts could now play an active role in delivering income and stability, particularly as cash yields begin to decline.
Sources 1. Bloomberg US Aggregate Bond Index vs. Bloomberg US Aggregate Bond Index Forward 5 Year Return as of 30/09/2025, accounts for the period of 1976 through 2024. It is not possible to invest directly in an unmanaged index. 2. ICE BofAML DM HY Constrained Index (USD Hedged) YTW. 3. 30Y FNCL Par Coupon Index. 4. While generally supported by a government, government-agency or private guarantor, there is no assurance that the guarantor will meet its obligations. 5. The Investment Association. December, 2024. 6. Source: Bloomberg Global Agg for global bond yields and the UK Generic 3M Government Bond Index.
UK fiscal pressures highlight the gilt opportunity
Globally, the story is similar. After years of ultralow rates, the “yield reset” following central bank tightening has transformed the return profile of bonds. “Historically, starting yields have been a strong predictor of future return potential" reminds Harrison. That point matters in a market where equities, especially in the US, remain highly valued. “The equity risk premium, the additional return expected for bearing the risk of equity investments, has declined,” Harrison says. “Historically, when equities are this expensive and bond yields this high, bonds have outperformed equities over the following five years. That is obviously the reverse of what we've seen over the last 10-15 years, and therefore not something that a lot of investors are expecting. That means that now is a very attractive time to think about reallocating out of some of those expensive equity allocations towards fixed income and high-quality global bonds.” Cash, by contrast, is losing its appeal. “While short-dated gilts and deposits looked attractive a couple of years ago, we believe central bank easing may steadily erode those yields. We believe by reallocating into high quality global bonds, wealth managers can currently capture 6–7% yields with the potential for capital upside if rate cuts deepen. These are the kind of portfolios that we aim to construct in our strategies, and so to us this is a very attractive time to reallocate into high quality global bonds”, says Harrison.
Moving beyond cash and expensive equities
The FCA’s consultation on pension reforms, coupled with the progress of the Pensions Bill, represents another structural driver in the market. The regulator’s message is clear: advisers must move beyond treating decumulation like accumulation. Tailored retirement income strategies are now required. For Hillenbrand, this is fertile ground for fixed income. “This shift presents a major opportunity for income-focused investments, and that’s exactly where PIMCO can add value. We are well positioned to help UK intermediaries build strong fixed income portfolios for their clients. Our range of income solutions has a consistent track record – all backed up by PIMCO’s 50-year heritage.”
Retirement reforms sharpen the income challenge
Looking at overall asset allocation, both executives emphasise that UK investors tend to be underweight fixed income in their overall portfolios compared to global peers, with allocations often below 20%. That leaves portfolios exposed to equity drawdowns and cash erosion just as bonds are regaining their appeal. “Historically, gilts have been relatively straightforward investments. Yields have been high, but with both cash and gilt rates expected to come down, now is the time to start thinking more strategically,” Hillenbrand argues. For Harrison, the conclusion is clear: “With UK interest rates projected to fall to around 3.5% or even lower, we’re now seeing very attractive returns by rotating out of cash and gilts into high-quality global bonds. This shift could provide a yield pickup to around 6–7%, all while maintaining exposure to a diversified portfolio. Essentially, the aim is to build portfolios that are not only robust but could potentially deliver equity-like returns, yet with lower levels of volatility. It’s a very exciting moment to consider allocating to these types of exposures right now.”
Time to rebalance UK allocations
The message for investors from Harrison and Hillenbrand is unmistakable: fixed income is no longer just a defensive anchor, it is once again a proactive source of income, diversification and potential outperformance within portfolios. With fiscal pressures mounting, regulatory reforms reshaping retirement advice, and global growth slowing, the case they make for bonds is powerful. The backdrop of higher starting yields reinforces this view. Yet accessing these opportunities, beyond conventional gilts and corporates, requires the global reach and analytical depth that only a handful of managers can offer. For PIMCO, this is the moment to demonstrate both its breadth and depth of resources, as well as its renewed commitment to the UK wealth market. “For us, it’s all about seeking consistent and predictable income from fixed income assets, which we believe will be a key priority for wealth managers and advisers,” says Hillenbrand. “We’re ready to support clients and intermediaries and believe we’re extremely well placed to do so.”
Fixed income as foundation once more
Not all bond exposures are created equal, however. Harrison believes that traditional investment grade and high yield spreads look quite tight right now, limiting their value. That’s why the PIMCO team advocates for diversification across the full fixed income spectrum. “It is possible to find areas of value in conventional credit, but you must work hard, and we see the best opportunities in broader fixed income markets,” says Harrison. “Agency mortgages in the US, for example, can provide 5% plus yields from an asset that is guaranteed by the US government.” Similarly, selective emerging markets offer attractive opportunities in a disinflationary environment. Latin America and South Africa are among the markets where high starting yields combine with scope for central bank rate cuts, and look capable of delivering both income and capital upside. For wealth managers used to seeing bonds as either “gilts versus corporate credit,” this breadth of approach really matters.
Diversification means more than traditional credit
For Hillenbrand, the ability to harness those global opportunities that Harrison highlighted depends on scale and expertise. PIMCO’s global platform, which has over 200 portfolio managers and 80 credit analysts operating around the clock, gives it reach across every segment of the bond market. Few managers, Hillenbrand argues, can replicate that depth. To improve access to UK markets, PIMCO has also made a spate of new hirings in London and regionally, along with the creation of a Strategic Partners unit focused on intermediaries. “We are out on the road meeting advisers, wealth managers and their teams, and we’re planning to do much more,” Hillenbrand says. The aim is simple: to ensure UK advisers can translate PIMCO’s global insights into practical portfolio solutions.
Active management as a differentiator
Read PIMCO's Investment Ideas for 2026
“For those who have long treated bonds as the “defensive ballast” in multi-asset portfolios, today’s market environment demands a fresh look”
Xxxxxxxxxx
Rupert Harrison, UK Senior Advisor, PIMCO
“Historically, when equities are this expensive and bond yields this high, bonds have outperformed equities over the following five years”
Simon Hillenbrand, Head of UK Wealth Management, PIMCO
Rupert Harrison, PIMCO’s UK Senior Advisor and Simon Hillenbrand, Head of UK Wealth Management at PIMCO, stress that the current environment presents one of the most compelling moments in years to reallocate toward bonds
All investments contain risk and may lose value. Statements concerning financial market trends or portfolio strategies are based on current market conditions, which will fluctuate. There is no guarantee that these investment strategies will work under all market conditions or are appropriate for all investors and each investor should evaluate their ability to invest for the long term, especially during periods of downturn in the market. Investors should consult their investment professional prior to making an investment decision. Outlook and strategies are subject to change without notice. PIMCO as a general matter provides services to qualified institutions, financial intermediaries and institutional investors. Individual investors should contact their own financial professional to determine the most appropriate investment options for their financial situation. This material contains the opinions of the author and such opinions are subject to change without notice. This material has been distributed for informational purposes only and should not be considered as investment advice or a recommendation of any particular security, strategy or investment product. Information contained herein has been obtained from sources believed to be reliable, but not guaranteed. PIMCO Europe Ltd (Company No. 2604517, 11 Baker Street, London W1U 3AH, United Kingdom) is authorised and regulated by the Financial Conduct Authority (FCA) (12 Endeavour Square, London E20 1JN) in the UK. The services provided by PIMCO Europe Ltd are not available to retail investors, who should not rely on this communication but contact their financial adviser. Since PIMCO Europe Ltd services and products are provided exclusively to professional clients, the appropriateness of such is always affirmed. No part of this material may be reproduced in any form, or referred to in any other publication, without express written permission. PIMCO is a trademark of Allianz Asset Management of America LLC in the United States and throughout the world. ©2025 PIMCO Europe Limited. All Rights Reserved.
Read more from PIMCO
China’s ability to sustain fairly robust economic growth despite a massive property sector downturn now faces new tests as global trade barriers rise and domestic demand weakened. Looking ahead, China’s excess industrial capacity and mounting inventories are likely to intensify deflationary pressures – forcing policymakers to either stimulate domestic consumption or tolerate slower growth. The recent fourth plenum acknowledges this economic reality, but how quickly China can shift its growth model inward remains uncertain.
China’s recent property sector bust is comparable in scale to Japan’s experience in the 1990s and the U.S. in 2008. After peaking in early 2021, nominal residential construction is down roughly 40%, according to China’s National Bureau of Statistics (NBS) – about 30% in real terms given a 10% price drop in building materials. Despite this, China’s broader economy still managed to grow roughly 4.5%–5% per year, with limited spillover into global financial markets. This resilience is largely due to government policies that stimulated growth in other sectors, especially manufacturing (EVs, batteries, solar), infrastructure, and exports, while containing contagion from the housing sector and spreading losses slowly over time. In 2024, this policy largely worked: materials originally manufactured for the Chinese property sector – such as steel and concrete – were instead exported to many emerging markets (EM), while Chinese green energy goods pursued European markets to increase global market share. With the property sector now 6% of China’s GDP in 2024 instead of 10%, net exports and investment drove most real GDP growth, while export prices fell and fierce internal competition shrunk margins and kept profits low.
Resilience amid a property downturn
Looking ahead, inventories can’t keep piling up if China wants to counter deflationary trends and maintain a stable economy. China’s policymakers have recently emphasized an “anti-involution” campaign to counter the intense competition and focus on higher-quality growth. However, unless China is willing to more forcefully stimulate domestic demand, or tolerate slower production growth, Chinese products will need to continue to be exported at further price discounts to clear the inventory levels. Fiscal stimulus is coming but so far has had limited impact, and deflationary pressures may continue to spillover globally with countries that have low trade barriers – such as many in Europe – most affected.
Policy at a crossroads
China’s supply- and export-driven growth model now faces limits. Many EM economies have erected higher tariff and trade barriers on Chinese goods, Europe has initiated investigations into Chinese product dumping, and the U.S. has raised tariffs, restricting Chinese access. Although recent meetings resulted in a truce for U.S.-China trade tensions, the relationship will likely remain volatile and with trade volume continuing its longer term downtrend. China’s third-quarter real GDP data reflect these trade challenges. While headline figures were better than expected, breaking down the official figures by GDP expenditure categories reveals underlying weakness. Private domestic demand (i.e. private consumption plus investment) saw its largest quarterly contraction since the pandemic, with the contraction in fixed asset investment spreading from property to manufacturing and infrastructure. Even growth in state-owned enterprise investment, previously stable, has fallen recently. Inventory accumulation accounted for much of the positive GDP surprise in the third quarter, following a large build-up in the second quarter.
Overall, the latest data suggest that despite stronger-than-expected reported real GDP growth, China’s domestic conditions have weakened recently while trade growth is slowing (trade with Africa is an exception). Despite these challenges, Chinese production has continued at a robust pace, with both raw materials and finished goods inventories accumulating.
Export-driven growth meets global pushback
Source: Haver Analytics, China Economic Information Center (CEIC), and PIMCO calculations based on Reserve Bank of Australia methodology
A closer look at China’s latest quarterly GDP data suggests risks to its growth model (quarterly real GDP broken down by category contributions)
“China’s excess industrial capacity and mounting inventories are likely to intensify deflationary pressures”
Stephen Chang, Portfolio Manager, PIMCO
Despite weathering a historic property slump, China’s growth momentum now faces headwinds from weakening domestic demand and escalating trade tensions
Important information FOR PROFESSIONAL INVESTORS AND/OR QUALIFIED INVESTORS AND/OR FINANCIAL INTERMEDIARIES ONLY. NOT FOR USE WITH OR BY PRIVATE INVESTORS. This is a marketing communication. Before making any final investment decisions, and to understand the investment risks involved, refer to the fund prospectus and KIID/KID, available in English and in your local language (depending on local country registration), from the relevant fund page or literature section on www.artemisfunds.com. The documents can also be found on www.fundinfo.com. CAPITAL AT RISK. All financial investments involve taking risk and the value of your investment may go down as well as up. This means your investment is not guaranteed and you may not get back as much as you put in. Any income from the investment is also likely to vary and cannot be guaranteed. Investment in a fund concerns the acquisition of units/shares in the fund and not in the underlying assets of the fund. The fund is a sub-fund of Artemis Investment Funds ICVC. For further information, visit www.artemisfunds.com/oeic. Any research and analysis in this communication has been obtained by Artemis for its own use. Although this communication is based on sources of information that Artemis believes to be reliable, no guarantee is given as to its accuracy or completeness. Third parties (including FTSE and MSCI) whose data may be included in this document do not accept any liability for errors or omissions. For information, visit www.artemisfunds.com/third-party-data. Any forward-looking statements are based on Artemis’ current expectations and projections and are subject to change without notice. Issued by Artemis Fund Managers Ltd which is authorised and regulated by the Financial Conduct Authority.
Find out more about the Artemis Short-Duration Strategic Bond Fund
Source: The IMF
Cyclically adjusted primary balance for 2026 - successive IMF forecasts
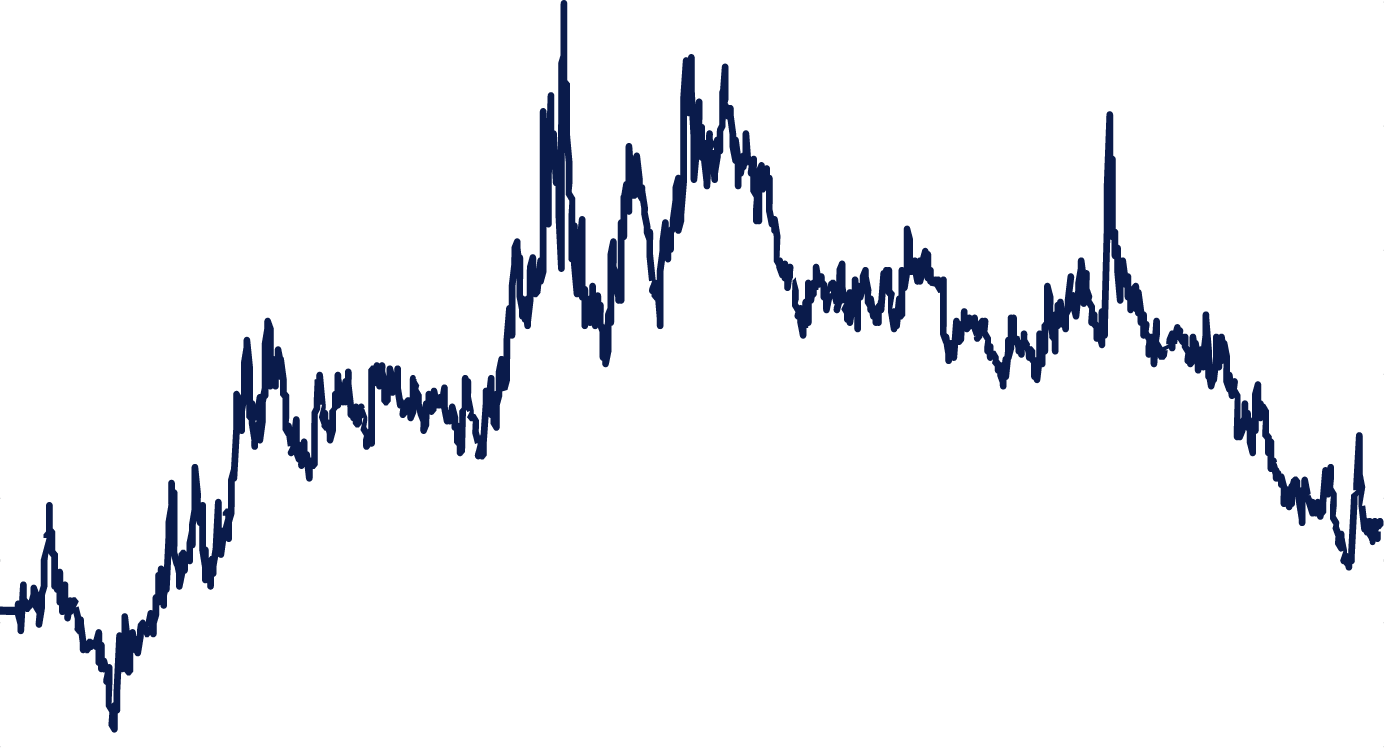
Source: Bloomberg
3Y UK real yields
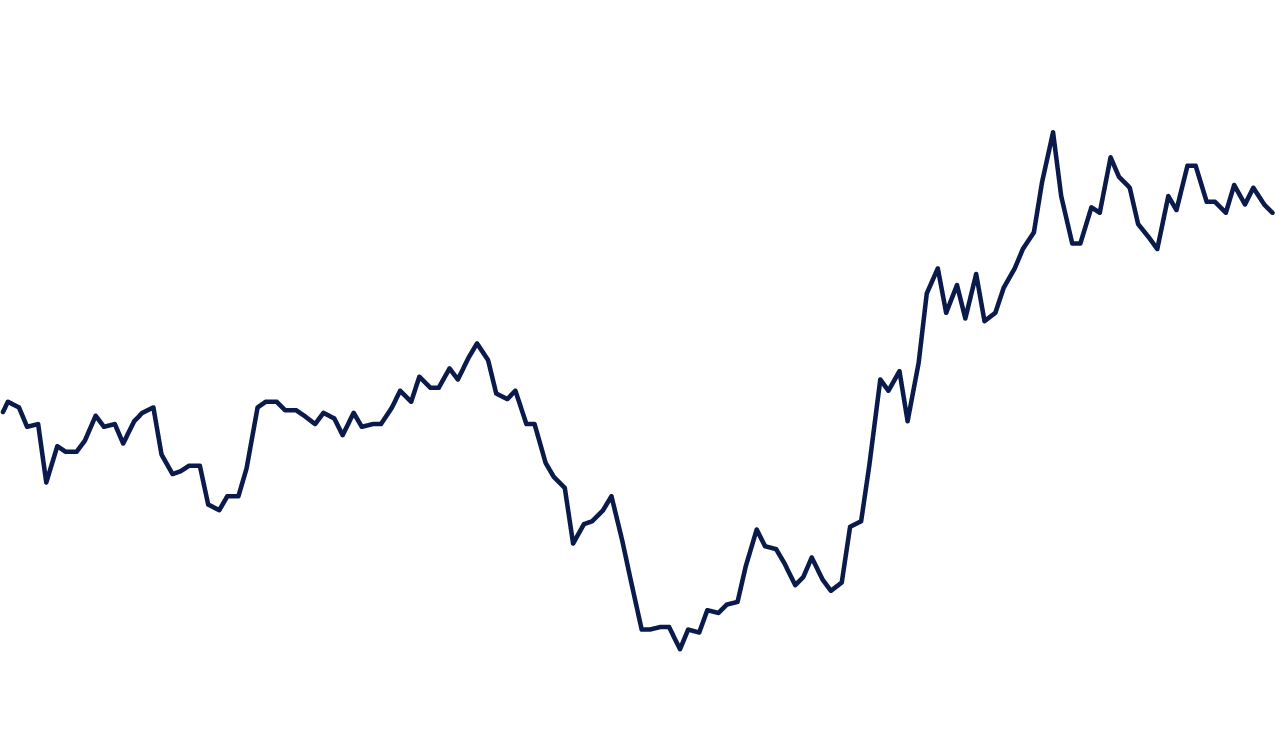
Safe-haven bonds
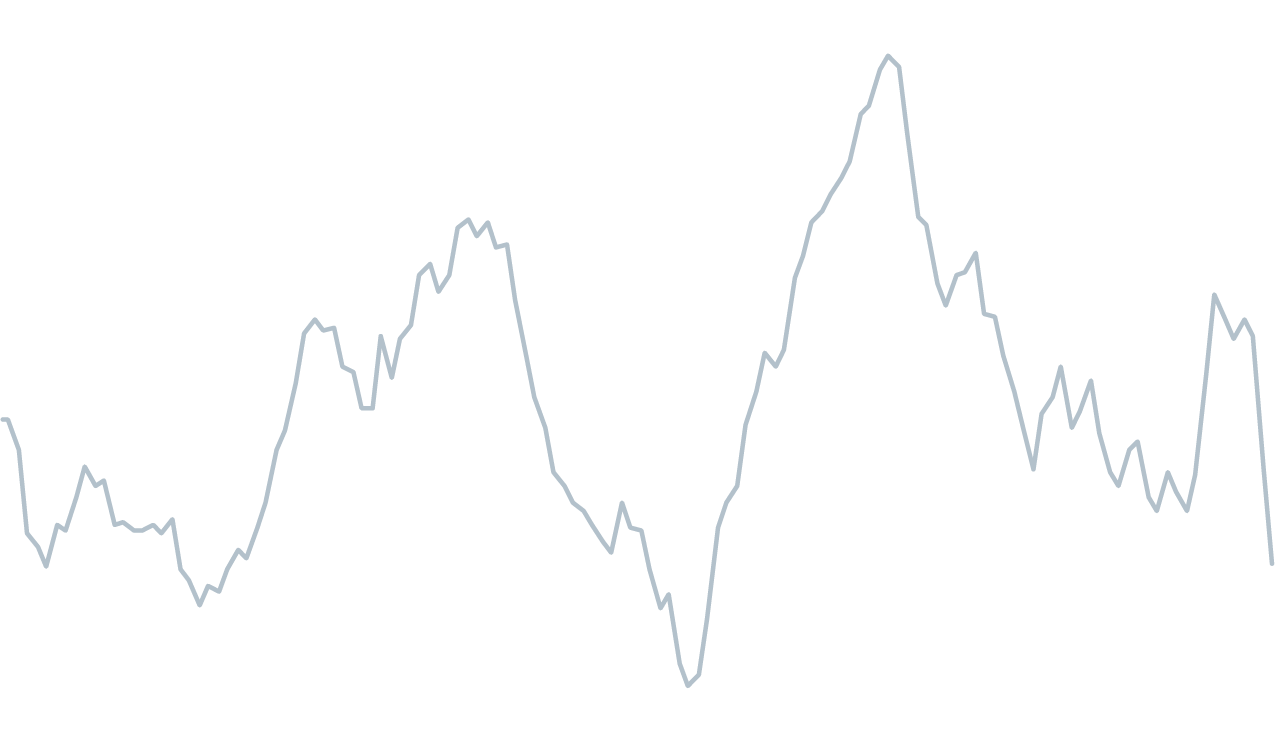
Bonds didn't provide diversification in the "scary inflation" regime
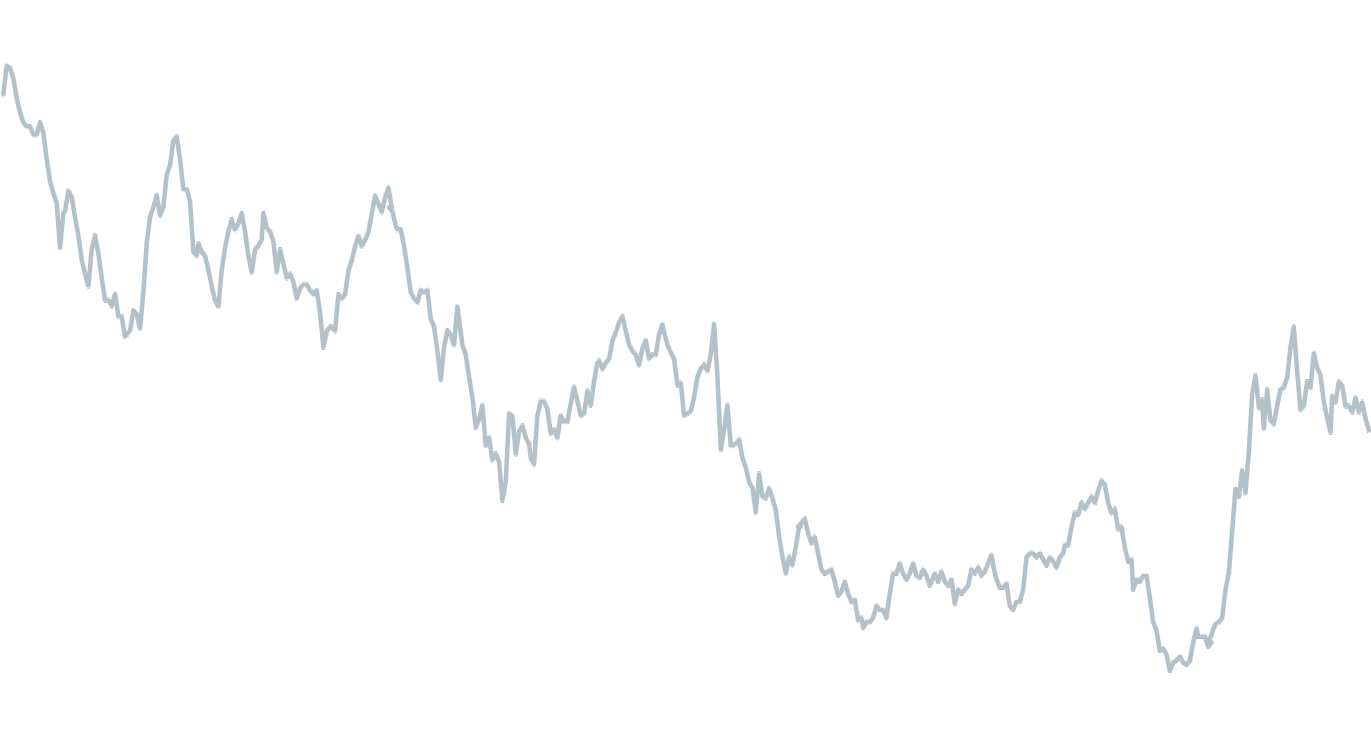
Bonds negative equity correlation returned in 2025
Historically, government bonds offered protection during risk market sell-offs
Investors instinctively gravitate towards traditional safe havens during periods of stress. Classic ‘risk off’ assets such as sovereign bonds, reserve currencies and gold typically offer ballast to portfolios when uncertainty rises. Yet the post-Covid experience challenged historical norms. Yes, gold has reasserted its appeal as a store of value and been a clear winner, especially over the past year. But elevated inflation, aggressive and unconventional monetary and fiscal policy along with sharp shifts in real interest rates have eroded the protective qualities of some havens, particularly government and long-duration bonds.
For the most part, asset markets have been so resilient to shocks in recent years that an investor buying the MSCI World or some other global index hasn’t needed a haven…
The post-Covid regime created two significant shifts that affected the classic inverse relationship between equities and fixed income – a huge uptick in government bond supply and an aggressive hiking regime necessitated by a surge in inflation. While we seem to be over the worst of the latter shock (albeit we remain in a stickier inflation regime), the deluge in government bond supply is likely to remain as governments around the world ramp up spending.
I am comfortable that now we have transitioned from the ‘scary’ to the ‘sticky’ inflation regime, longer-dated bonds can regain some of their poise in risk-off periods. However, while fiscal policy continues to run hot, the leap of faith required to forego still attractive valuations in shorter-dated fixed income is a leap too far, in my view… I say this even though the outlook for interest rates is more balanced this year.
Only the most bearish commentator would discount what looks like a broad-based global reacceleration in economic output across the G10. Certainly 2026 should at least see an equal share of hikes as well as interest rate cuts across developed markets. In this regime, an active approach to fixed income management is key. We can look to Japan (the central bank of which is clearly behind the curve) and markets such as Australia/New Zealand as countries most likely to hike rates, whereas the UK (out of necessity) and the US (out of political interference) should see a continuation of easing cycles into the end of this year.
Are safe-haven assets redundant?
So why do I continue to prefer short-dated fixed income? Despite spread compression, investors are being compensated in real terms at a level not seen for the past decade. Simply put, a higher-for-longer environment means investors earn higher yields. In the front end of the curve, investors are compensated with above-cash and inflation-beating returns. Just look at the real return available on short-dated UK government bonds (which I expect to benefit from more interest rate cuts this year). Having been significantly negative for an extended period, investors are now compensated in real terms.
For the Artemis-Short Duration Strategic Bond Fund, our primary area of focus is short-dated UK investment grade bonds – so the yield available is even more attractive for investors. Add in our ability to pick out high-quality short-dated high-yield securities and the proposition becomes even more compelling. So, while valuations have certainly become more compelling for longer-dated bonds, short-dated fixed income is still the sweet spot in my view.
Higher interest rates mean higher yields
Attractive valuations in shorter-dated bonds
“While fiscal policy continues to run hot, the leap of faith required to forego still attractive valuations in shorter-dated fixed income is a leap too far?”
Liam O'Donnell, Fund manager, Fixed income
“The deluge in government bond supply is likely to remain as governments around the world ramp up spending”
Liam O'Donnell Fund manager, Fixed income
Loosening in fiscal stance vs. 2024 forecasts
Tighter fiscal stance
FOR PROFESSIONAL INVESTORS AND/OR QUALIFIED INVESTORS AND/OR FINANCIAL INTERMEDIARIES ONLY. NOT FOR USE WITH OR BY PRIVATE INVESTORS. This is a marketing communication. Issued by: Artemis Investment Management LLP which is authorised and regulated by the UK Financial Conduct Authority.
Find out more about Artemis' fixed income capabilities
2. What are the big opportunities for bond investors in 2026?
Divergence. The big, directional markets of the QE (quantitative easing) and Covid eras are well and truly behind us. In government bond markets, we can see the theme play out in different fiscal outlooks for G7 countries as well as more divergence in policy rates. While we saw almost universal policy hikes then cuts going into and out of Covid, in 2026 we will see some countries continuing to cut (the UK and the US), some holding (Australia) and others even looking to hike (Japan and Sweden). Such directional divergence and the magnitude of movements will create volatility and significant relative value opportunities. This is not a market that will reward a static and directional duration stance. Rather, valuations will distort and revert quickly, while investors can generate returns without relying on directional calls. Crucially, active managers will be able to take advantage of such volatility, unlike passive funds which become forced buyers and sellers in such scenarios. Turning to credit, while we don’t claim markets are super cheap in aggregate, pockets of value remain. Within investment grade, we are interested in domestically focused companies with robust supply chains. We also like senior financials, notably those older vintage or ‘grandfathered’ securities (those that continue to be subject to older laws or rules) that no longer suit their issuers. In global high yield, we see the best opportunities in short-dated exposure in higher quality names rated BB and B where we can exploit refinancing dynamics to generate additional returns. Stock selection has always been important, but in a divergent world it becomes especially so.
3. What is the risk to investors’ capital if the consensus is wrong?
The main threat to markets as we see it is if the growth outlook worsens markedly. The real yields available in government bonds will offer a degree of protection – and we have seen bonds display their traditional ‘risk off’ behaviour in recent market wobbles – and as such we think a degree of fundamental, but actively managed, duration exposure is warranted, ideally in the belly of the curve (medium-term maturities). On the other hand, a traditional long-duration exposure in response to growth fears may not be as protective as hoped. We believe markets would very quickly look to the fiscal response demanded by voters and that could have grave implications for long bonds. For credit, history tells us that growth concerns would hit the weakest parts of the market, notably subordinated financials and the lower reaches of high yield. As such, we are largely eschewing these areas, focusing instead on company-level resilience and cashflow over yield. Again, we feel that an active, stock-specific approach, rather than generically buying a credit index or market, will deliver the best results for investors.
The presence of positive real yields in government bond markets indicates both concerns as to the deteriorating fiscal picture for most economies and the reasonably positive outlook for growth. In addition to the yield backdrop, the steepness of curves speaks to a bond market that doesn’t view conditions as being overly tight and a cycle that is not in immediate danger. Notwithstanding the above, I would caution against reading too much into government bond markets. While they are often credited with providing a leadership position for every other asset class, it is difficult to get an invite for the committee meetings where bond investors like us apparently decide to invert curves before ‘inevitable’ recessions. The picture for households and corporates is much better: nearly four years into the hiking cycle, debt levels for both are at healthy levels. Corporates have responded to higher rates by deleveraging balance sheets, while household stress from higher rates is largely absent. As such, we don’t see the recent reduction in credit spreads as being unwarranted.
1. What do yields and spreads currently tell investors about bond markets?
A year is a long time in fixed income. Just 12 months ago, monetary and fiscal policy were expected to provide support for bond markets via across-the-board interest rate cuts and a normalisation in government spending following the Covid-era highs. Today, stubborn inflation means rates could soon begin to rise once more. Any attempt to cut government spending has been met with resistance and there is little room to raise taxes. This leaves bond markets to pick up the tab. So, what do the next 12 months hold? Below are the three big questions investors should be asking about fixed income in 2026 – and crucially, the answers.
“It is difficult to get an invite for the committee meetings where bond investors like us apparently decide to invert curves before ‘inevitable’ recessions”
David Ennett, Fund manager, Fixed income
“This is not a market that will reward a static and directional duration stance”
David Ennett Fund manager, Fixed income
Don’t leave money on the table. It’s a central tenet of investing to seek the most from every opportunity and not settle for less than you could potentially earn. Investors in passive fixed income allocations have been leaving money on the table. Passive investing has grown in popularity ever since the first S&P 500 index-tracking fund launched in the 1970s. Many investors have been drawn into passive fixed income allocations, such as index-tracking funds, amid a common refrain that passive is better because it costs less. But in fixed income, the numbers tell a different story: The myth that active managers can’t beat the market after fees is demonstrably false in bonds. Passive fixed income investors pay less and may get less. Back in 2017, PIMCO published “Bonds Are Different: Active Versus Passive Management in 12 Points.” The publication showed that a majority of active bond funds and exchange-traded funds (ETFs) beat their median passive peers after fees over a variety of time periods. Given everything that’s happened since 2017, we thought we would revisit that thesis to quantify how it has held up. Let’s look at some hard data, focusing on the true apples-to-apples comparison: net-of fee returns. Our analysis, spanning two decades, shows that Active Bond Funds in general have outperformed their passive counterparts in 64% of the rolling 10-year periods examined (see Figure 1). This is well above the 43% rate of Active Equity Funds beating their passive peers:
Again, that analysis spans two decades – from a financial crisis to a pandemic, from the 10-year Treasury yield reaching its all-time low to an inflation spike to a generational reset higher in bond yields, from bear to bull markets and everything in between. Across that vast variety of conditions, active management in fixed income outperformed passive on average. Yes, active management costs more – typically about 35 basis points (bps) more across the five largest Morningstar fixed income categories by assets under management, as of 30 September 2025. But when active management is generating more than that in terms of alpha, or outperformance versus the broad market, the math is simple. Net-of-fees, active fixed income can deliver improved returns.
Passive fixed income investing has a poor track record in part due to bond market quirks that favor active management. For example, almost half of the global bond market consists of investors such as central banks, insurance companies, and commercial banks that operate with unique objectives and constraints. Many of these investors seek beta, or broad-based market exposure, rather than alpha. Their primary mandates – think currency management, regulatory capital, or book yield – can create persistent market inefficiencies. For example, when passive funds are locked into following periodic index rebalancing rules, market prices move, allowing active managers to anticipate, act, and seek to profit. The complexity of bond markets makes index replication challenging. Unlike equities, bonds mature, creating constant turnover. Bond indexes also assign the highest weights to issuers with the most debt outstanding, not necessarily those with the best economic value. Passive managers often hold less than half the index, leading to tracking error. New bond issues are often priced at a discount to attract buyers, and active managers can look for these opportunities. Structural alpha, sought by identifying repeatable market inefficiencies, is a key tool for active management outperformance.
Market inefficiencies create active opportunities
Investors have a variety of goals. Pension funds need liability matching and real returns. Endowments and sovereign wealth funds seek diversification. Individual investors often look for income and diversification from stock-market volatility. Passive fixed income strategies typically take a one-size-fits-all approach and have a history of underperformance versus their active peers on average. Active management has historically delivered improved after-fee returns, greater flexibility, and customized solutions versus passive peers on average. With today’s robust market liquidity in public fixed income, active managers can shift across sectors, geographies, and maturities – something passive funds simply can’t do. With starting yields near multi-year highs and geopolitical volatility creating fresh opportunities, now is the time to consider making the switch. Don’t leave money on the table – make your fixed income allocation work harder for you.
Conclusion: Active investing for improved outcomes
Learn more: Listen to PIMCO's Podcast on The Active Advantage
“Active Bond Funds in general have outperformed their passive counterparts in 64% of the rolling 10-year periods examined”
Xxxxxxxxxxxx
“Passive fixed income strategies typically take a one-size-fits-all approach and have a history of underperformance versus their active peers on average”
Past performance is not a guarantee or a reliable indicator of future results. Source: PIMCO and Morningstar as of 30 September 2025.
Figure 1: Active fixed income has a long-term record of outperformance
29 bps
-28 bps
64%
43%
Average excess returns of active funds over the median passive peer across rolling 10-year periods, net of fees
Percentage of active funds outperforming the median passive peer over rolling 10-year periods, net of fees
All active bond funds
Active bond funds
Active equity funds
All active equity funds
Marc Seidner CIO Non-traditional Strategies
Mohit Mittal CIO Core Strategies
To read the full report and find out how investors can take advantage of fixed income opportunities in 2026, click here.
Following strong 2025 returns, high quality fixed income continues to offer attractive yields and global diversification at a time of stretched equity valuations and tight credit spreads.
The Trump administration’s sweeping tax, trade, and immigration policy overhauls – including quadrupling the effective US tariff rate – were widely expected to stifle global growth, trade and investment. In response, various DM and EM governments announced pre-emptive yet targeted fiscal measures to buffer the economic transitions, while central banks focused on downside risks. It turns out that economic growth has been surprisingly resilient as these policy trends intersected with a new general-purpose technology: AI. The result has been a lasting expansion with notable divergence under the surface. “K-shaped” economic trends are apparent across households, companies, and regions. Indeed, those who are better positioned to benefit from the AI race and associated wealth effects are fuelling growth. Several key macro trends have unfolded:
Economic outlook: Dimensions of divergence
Most central banks embarked on rate-cutting cycles over the past few years, albeit at differing speeds based on inflation progress. With global inflation now broadly benign, we expect most central banks to reach neutral policy levels by the end of 2026. However, the outlook for additional cuts is now more nuanced. Central banks with still-high real rates and tight fiscal policy are poised to cut more aggressively, particularly in countries more exposed to downside inflation risks from Chinese exports. This includes various EM central banks, as well as the Bank of England. Elsewhere, where monetary policy is already near neutral and fiscal policy is poised to expand – notably Canada and, to a lesser extent, Europe – there is limited need for additional cuts. The Bank of Japan, meanwhile, with still-easy monetary policy and where fiscal policy is set to expand, is expected to hike rates further (see Figure 2), while in China both monetary and fiscal policy are expected to ease substantially, as policymakers manage debt deflation and overcapacity.
Monetary policy set to diverge
Finally, markets are pricing expectations for the US Federal Reserve to lower its policy rate further, to 3%. We also expect Fed cuts in 2026, likely in the latter half of the year. Uncertainty remains about the terminal rate amid a transition to a new Fed chair and as the White House pushes for lower rates. While there is a range of possible outcomes, the market has consistently priced a continuation with orthodoxy, reflecting the fairly conventional candidates and checks and balances inherent in the Fed policy-setting process. The risks around US inflation also look more two-sided. AI-fuelled productivity and stagnant housing market trends could help keep overall prices in check. Tariffs, demand-augmenting fiscal policy, and technological infrastructure buildout could push prices higher.
We expect overall economic resilience to continue in 2026. There are also good reasons to expect some broadening in growth, but the trend toward winners and losers is likely to persist. First, fiscal policy is set to diverge across countries. Fiscal policy easing in several regions should further offset trade drags. China, Japan, Germany, Canada, and the US are all poised to loosen fiscal policy – China through central government support, and the US via large, front-loaded business and household tax cuts. But many countries lack fiscal space, leaving policy tight in the UK, France, and parts of EM. Second, the AI investment cycle should keep supporting global growth as AI adoption spreads, but winners and losers will abound. In the US, broader corporate spending on AI implementation, software, and R&D could offset cooling data centre capital spending from high 2025 levels. An additional tailwind could come from other countries stepping up infrastructure investment amid national security concerns. In the race for AI dominance, regional and industry laggards are at risk. Third, trade uncertainty and tariff-related drags should also diminish in 2026, but not without further policy shifts as the legality of US tariffs is tested. The US Supreme Court could potentially strike down some or all tariffs implemented under the International Emergency Economic Powers Act. As the Trump administration shifts tariff policy to a more stable and legally secure framework, various regions and sectors will need to adjust, while reduced uncertainty reaccelerates investment and hiring, both in the US and globally.
In the US, elevated competition has limited corporate pricing power and muted tariff-related price increases. Large companies are focusing on gaining market share by competing on price and absorbing tariff costs, fuelling a productivity push to protect margins. Small and midsize labour-intensive companies exposed to trade sectors or immigration policy changes have been relative losers. To defend margins, companies accelerated AI adoption to manage labour costs. In the US, AI-related software and R&D investment accelerated, while data centre investment, including structures, servers, chips, and other components doubled. Policy and technology changes also contributed to a US household divide. The wealth effect of AI-led stock market gains has helped sustain consumption, but the benefits haven’t reached lower- and middle-income households (see Figure 1). As elevated uncertainty has stifled hiring and trade- and AI-exposed sectors shed jobs, real labour income growth has stalled. The AI related build-out also appears to be crowding out other investment, including residential housing, further reducing housing affordability.
AI trends have supported global industrial output and trade despite tariff drags, although gains remain uneven. Growth is concentrated in computers and components tied to AI infrastructure. Asian economies, including Taiwan, Japan, South Korea, and China, have shared the US’s resilience as they dominate production of chips, servers, and related hardware. Production elsewhere has slowed as earlier inventory stocking ahead of tariffs unwinds. China is being pushed to find other markets for its goods, while also accelerating its AI infrastructure build-out and further improving manufacturing productivity. US tariffs have reduced trade between the two nations. Lower export prices have facilitated a smoother-than-expected trade rotation to EM. Still, sluggish consumption and falling investment have left China overly reliant on exports and inventory building to maintain growth.
• • •
• •
Technology and fiscal policy bolster demand
Source: Haver Analytics, PIMCO calculations as of 30 September 2025
Figure 1: Equity-based wealth gains have recently outpaced labour income growth
Source: PIMCO as of December 2025
Figure 2: We see increased likelihood of policy divergence in 2026
“Asian economies, including Taiwan, Japan, South Korea, and China, have shared the US’s resilience as they dominate production of chips, servers, and related hardware”
Andrew Balls, CIO Global Fixed Income