FUNDS WATCHLIST
ISSUE 3 / NOVEMBER 2021
At time of writing (17 November), UK inflation alone soared to a ten-year high of 4.2% in October; more than doubling the Bank of England’s target and above consensus predictions. And, earlier this month, US inflation surged to its highest level since 1990, with October’s consumer price index recording a year-on-year increase of 6.2%.
ver the last quarter, there has been plenty for the world of investment to grapple with. Inflation appears to be topic du jour, with heightened demand for goods, rocketing energy prices, a supply-chain squeeze and the reopening of economies responsible for a global inflation surge.
The debate has progressed from whether we will find ourselves in an inflationary environment, to how long this period of inflation will last for. This is anyone’s guess, given central banks around the world are sending mixed signals.
Where we are in the economic cycle, and central bank policy, dictates which asset classes and parts of the market investors find attractive. Usually, at the beginning of the cycle, higher risk and more economically sensitive assets are considered attractive. Emerging markets are typically included in this, but they have been lagging their developed market counterparts.
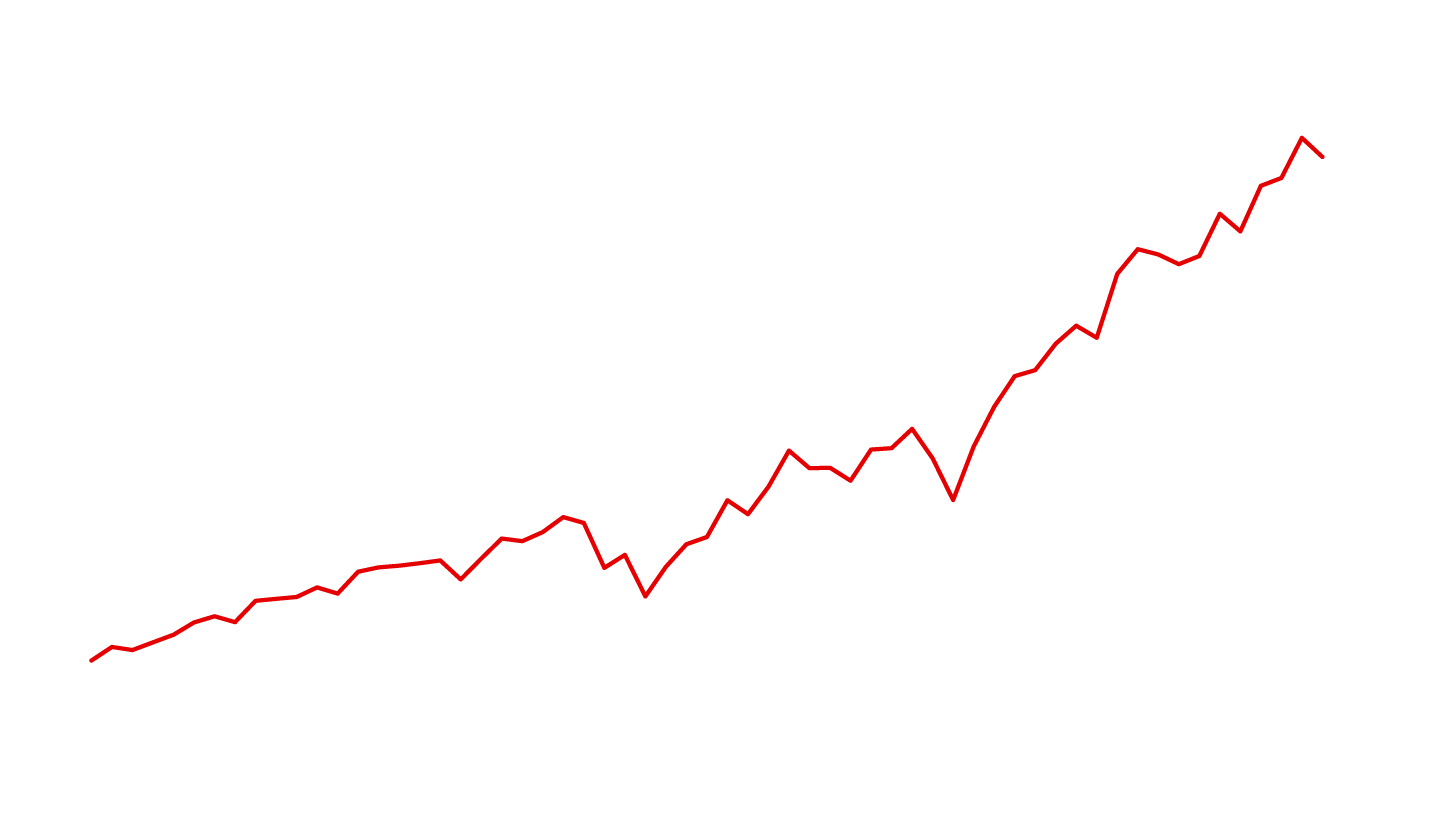
According to data from FE fundinfo, the MSCI Emerging Markets index has returned 4.5% year to date, compared to the MSCI ACWI and MSCI World indices’ respective gains of 14.8% and 16.2%. While its performance has ticked up slightly over the last three months, having returned 6.2%, the ACWI and World indices have still returned a respective 7% and 7.2%.
The reason behind this is country specific. India has shot the lights out year to date, thanks to a recovery from the Delta variant of Covid, and a cohort of tech and healthcare-focused IPOs coming to market.
China, however, tells a different story.
O
CLOSE
Editor's view
China's change in fortune, the Asia divide and why we need to act now to curb climate change
Lauren Mason, editor, Investment Week, reviews some of the key market themes from over the last quarter, including China's underperformance, 'Digital India', COP26 and initiatives to tackle greenwashing
H
aving been the darling market of 2020 as one of the first economies to reopen post Covid, China’s fortunes have turned on their head this year following a regulatory crackdown on tech stocks.
It started with the People’s Bank of China (PBOC) pulling the plug on Ant’s IPO at the tail-end of last year, and has since extended to numerous internet companies as it sought to penalise monopolies and the ‘platform’ economy – in other words, companies offering a range of online services under one umbrella firm.
The introduction of new legislation spooked markets, as the likes of Alibaba was fined $2.8bn while taxi-hailing firm Didi was made to suspend user registrations.
Meanwhile, the China Evergrande Group – China’s second-largest property developer – has been teetering on the edge of collapse, which has also worried investors given its $300bn in liabilities and links to numerous banks. And, with power shortages across the country due to a torrid combination of increased demand for goods, market distortions such as energy rationing and contradictory policies from the Chinese Communist Party, it is no surprise Chinese equities are in the doldrums.
But this does not necessarily mean investors should give the country a wide berth. WisdomTree Europe’s director of research Aneeka Gupta recently told Investment Week that regulatory concerns from western investors “stem largely from the lack of understanding of the East”.
“China is vying to be a leader in many aspects of technology such as semiconductors, medical devices, AI, green technology, and various forms of automation, but in a way that benefits ordinary people rather than a few billionaires with unicorn IPOs,” she reasoned.
In fact, it is these low valuations and common misconceptions that have made China a fertile ground for active managers, according to FountainCap chair and CIO Frank Ding, who heads up the firm’s Greater China Select fund. As can be seen in this booklet, he believes the key to success is understanding the intercorrelation between the country’s economic, political and market cycles in order to identify the best opportunities. Ding also believes navigating the volatility of the market is best achieved through on-the-ground research, an in-depth cultural understanding and by considering China as a composition of 33 provinces – each with their own economics and demographics – as opposed to as one behemoth country.
Global, EM and China indices year-to-date
Source: Refinitiv
Mobile payment boom: 750 million Indian citizens have access to a mobile payment system tied with the biometric Aadhar card, which uniquely identifies an individual and is easily accessible by any business or government services
Meanwhile, North Asian countries such as South Korea and Taiwan have reaped the benefits of successfully containing the pandemic over the last 18 months, with the latter even recording positive GDP growth for 2020. They have also seen their tech-related firms grow exponentially, with some 40% of the North Asian segment of the MSCI AC Asia pacific ex Japan index now in technology firms, according to research from Schroders. This is more than double the tech weighting across the rest of Asia.
It is no surprise, then, that the team at Matthews Asia ex Japan Dividend are finding exciting high-growth opportunities among “undiscovered” small and mid-cap Asian companies. What sets this fund apart from many of its peers, however, is that it blends these higher growth stocks with rising dividends, with stable yielding stocks. This means it can participate in both growth and value markets.
Turning to Asia
Given China’s size and level of influence, its underperformance will inevitably impact global indices, and particularly global emerging market and Asia Pacific indices. According to data from FE fundinfo, the MSCI AC Asia Pacific ex Japan index has returned 3.2% so far this year, which on the surface looks lacklustre relative to its western counterparts.
But, as mentioned previously, the fact MSCI China has suffered double-digit losses, and that the country accounts for 33.6% of the index, means the modest return is no mean feat, with fellow constituent countries including Taiwan, India and Australia all posting double-digit gains so far this year.
India has been the star of the show, having proved economically resilient against the Delta variant of Covid. It has also seen a slew of IPOs come to market so far in 2021 which, according to research from Ashoka India Equity investment trust’s Ramesh Mantri, are worth more than $12bn in aggregate. It has proven to be a fertile ground for start-up businesses, with more than 70 unicorns at present, putting it in third place behind the US and China for its number of $1bn-plus privately-owned start-ups.
“We see significant interest in the new-age technology space, including consumer tech and fintech,” Mantri said. “Favourable demographics and an engaged, mobile-first, convenience-first audience have propelled consumer tech businesses forward.
“This has been supported by government initiatives like ‘Digital India’, a push to improve digital infrastructure and internet connectivity throughout the country.”
Divergence of EM regions year to date
Taking the temperature
But while some parts of Asia are hitting the financial headlines for the right reasons, India and China have come under scrutiny following COP26 in Glasgow earlier in the month, where they stymied commitment to end coal use and fossil fuel subsidies.
North Asian countries such as South Korea and Taiwan have reaped the benefits of successfully containing the pandemic over the last 18 months, with the latter even recording positive GDP growth for 2020
As negotiations overran, carrying on well into the night on the Saturday, tensions rose as India requested a last-minute change to the vernacular used in the Glasgow Climate Pact, from “phasing out” coal use to “phasing down”.
The jury is out on how much cause for optimism the asset management industry has following COP, although industry commentators largely agree the conference was a step in the right direction.
Some aspects, however, such as the 2050 net zero pledge made by the Glasgow Financial Allianz for Net Zero (GFANZ), came under fire from sustainability experts.
In a recent Investment Week article, published shortly after GFANZ committed $130trn of capital to reach net zero by 2050, and announced it can deliver $100trn of investment needed to reach net zero, several sustainability experts called the pledge a “hot air commitment”.
"It is like saying ‘we have produced enough food to feed eight billion people; therefore we have solved global hunger' - the two are not the same thing."
It is understandable that investors are growing increasingly wary of greenwashing, be that among firms or the products themselves. According to research from Morningstar published earlier this year, 256 funds rebranded existing products as ‘sustainable’ in 2020, up from 179 the year before.
As increasing numbers of new or rebadged products and teams join the market and profess their passion for ESG, it is always refreshing to come across teams that have held sustainability at their core before the acronym even existed.
Elsewhere, the AXA ACT Framlington Clean Economy fund is directing investors’ capital towards clean technology, with the aim of proactively funding the sectors that can permanently improve the way our economy functions. For example, portfolio manager Amanda O’Toole focuses on areas including low carbon transport, smart energy, the food industry and natural resource preservation. If these respective sectors of the economy cleaned up their act, the long-term benefits our planet would reap would be truly remarkable.
A good example of this is the Janus Henderson Global Sustainable Equity team, which this year, is celebrating its 30th anniversary. The Janus Henderson Global Sustainable Equity fund came to market back in August 1991 and, since then, it has grown its assets under management to £2bn and has comfortably outperformed its MSCI World benchmark and IA Global sector average with gains of more than 1,500%. Investors can read more about their process and philosophy in this publication.
Jeanne Martin, senior manager at ShareAction, warned "there are two problems with GFANZ's numbers".
"Firstly, the $130trn figure is simply wrong," she said. "It counts the total financial assets of all the members of the various GFANZ groups and adds them up to $130trn.
"It is true these financial institutions have all committed to reach net zero, but dig into the numbers and you see that they are not making this commitment for all of their assets."
In terms of being able to deliver $100trn to reach net zero, she warned there is "no guarantee we will get those capital investments" due to minimal regulation.
Regulatory tailwind: SFDR requires financial market participants to provide information on their sustainable products
Now that articles have to categorise themselves as Article 6, Article 8 or Article 9 (...) many vehicles have been forced to either commit further to ESG investing, or remove it from their marketing altogether
Making an impact
Generally speaking, this move away from basic exclusionary filters to positive impact mandates is immensely encouraging for the industry. These types of vehicles ensure their holdings are proactively making a difference to society and the environment which, given some of the aforementioned scepticism surrounding some of the COP pledges, is arguably more important than ever.
Nick Parsons, head of ESG at Thomas Lloyd group, recently told Investment Week that measuring the impact of a portfolio is “neither an art, nor a science, and requires a carefully considered blend of qualitative and quantitative metrics to judge the ‘additionality' of an investment; the extent to which it has brought about change - both positive and negative - which would not otherwise have occurred”.
“In line with SFDR, an investment must equally demonstrate that it has a positive impact, and that it does no harm,” he said.
Indeed, the introduction of Sustainable Finance Disclosure Regulation (SFDR) across Europe in March this year has had a significant impact on the asset management industry, further helping to eliminate the prospect of greenwashing.
Now that funds have to categorise themselves as Article 6, Article 8 or Article 9 – six being no integrated sustainability, eight “promoting” ESG characteristics and nine “targeting” sustainable investments – many vehicles have been forced to either commit further to ESG investing, or remove it from their marketing altogether.
It is clear the industry is taking this seriously, with Morningstar data showing that, as of end of September, 21.7% of funds available to retail investors in Europe were categorised as Article 8, while a further 2.8% were Article 9. Combined, this accounts for almost a quarter of the entire investable universe.
As an increasing number of pure-play impact funds enter the market, there are further reasons to be encouraged.
One such example, which will be launching soon, is the T. Rowe Price Global Impact Strategy, which will be headed up by Hari Balkrishna. As can be seen in this booklet, the fund uses a decision-making structure based on three pillars: Climate and Resource Impact, Social Equity and Quality of Life, and Sustainable Innovation and Productivity.
“It is important to distinguish that impact investing is not environmental, social, and governance (ESG) integration,” Balkrishna said. “It is also a different discipline from sustainable investing. It does, however, incorporate both but also takes a step further.”
Elsewhere in the market, there are products that have very specific focuses in terms of how they want to save the planet.
Lyxor, for example, offers a pioneering range of Climate ETFs, which select and weight companies that are collectively compatible with the Paris Agreement’s 1.5°C temperature target. They also apply numerous other ESG criteria, and as such, each fund in the range is listed as Article 9. It includes global, US, European and emerging market mandates, all of which share the common goal of limiting global warming in-line with the Paris Agreement.
As written in their article, the team said: “Severe changes to our climate are all but locked in unless we cut carbon emissions drastically.
“Governments must lead, but investors now have the tools to make a significant difference.”
AXA ACT Framlington Clean Economy
Amanda O’Toole, portfolio manager, AXA ACT Framlington Clean Economy
''Unsustainable human civilisation on earth is now a reality. Awareness of this is steadily rising among governments, companies and consumers alike, creating opportunities for investors across the clean economy”
Be a part of the Clean Economy
Climate change is already creating challenges in almost every part of our lives, demanding urgent solutions. Amanda O’Toole, portfolio manager of AXA ACT Framlington Clean Economy, explains how investors can help drive the transition to a more sustainable future by directing capital towards innovative clean technologies
for the future - it is already here.
inter storms in Texas, multiple cyclones in Fiji, record temperatures in Moscow, massive flooding in New South Wales and deadly wildfires in Greece. These are just a few of the extreme weather events the world has seen in 2021 which tell us climate change is no longer a problem
These types of events – and the massive human and economic cost of them – are pushing governments, corporations and individuals to understand we need to act now to preserve the future of civilisation on earth. Though not without challenges, the need for an urgent response is driving an acceleration in commitments to transition to a net zero world.
As individuals, many of us are making changes in our daily lives. Perhaps this entails committing to eat less meat, using low carbon transport wherever possible, adapting the home to be more energy efficient, or simply recycling as much as possible and producing less waste.
In fact, many corporates are seeing the benefits of investing in the transition from a profitability perspective. It is clearly cheaper to save on energy, be less wasteful and more efficient in use of resources. It should also be cheaper to apply a less carbon-intensive process given the carbon-related taxes starting to be implemented in many countries. So, a lot of businesses are starting to deploy cleaner technologies as a cost saving measure – even regardless of environmental considerations. This in turn is driving down the cost of producing clean technologies so that we can expect them to become the natural choice on a rational consumer basis.
W
The companies that develop these solutions are seeing the potential for decades of growing demand ahead for their technologies. As a result, there is an opportunity for the clean tech industry to progress faster than it has been doing to date. This is necessary as it is becoming clear that we do not have decades to develop potential future innovations in this field.
How do we act now?
It is cheaper to be cleaner
As consumers, we are also demanding more of the companies that produce the goods and services we use in terms of their environmental impact. As investors, many of us are increasingly choosing to direct our capital towards businesses and projects that contribute to the transition.
The investment opportunity
At AXA IM, we think it is certainly possible to secure long-term growth in high quality businesses which are associated with the transition, while simultaneously delivering a positive impact. We term this universe of companies ‘the clean economy’ and view it as a long-term structural growth opportunity with very solid drivers underpinning the theme.
The clean economy theme is applicable across sectors and geographies, while mitigating some of the risks with exposure to some of the ‘old world’ investment areas which now look most likely to be challenged by climate change.
From an investment standpoint, the problems associated with climate change touch almost every part of our lives. This means investing in the clean economy allows us to construct diversified portfolios from an enormous global opportunity set, offering greater potential resilience through the economic cycle.
If we are to move to a more sustainable economy, there are some key areas we need to make progress on immediately and over the coming decades. From how we transport people and goods around the world, how we source energy to power the economy, how we feed our growing population, to how we manage the fixed supply of scarce resources. These are the areas where we expect capital to be meaningfully deployed during the transition, therefore this is where demand for solutions should be most resilient.
Our Clean Economy strategy offers a diversified access to these opportunities by investing in companies across the four main investable areas we believe are the most significant in terms of the energy transition, the reduction of global greenhouse gas emissions and resource preservation. These are: Low Carbon Transport, Smart Energy, Agriculture and Food Industry and Natural Resource Preservation. Within these four sub-themes, we look for companies that are aligned with six environmental UN’s Sustainable Development Goals, as outlined below.
The UN Sustainable Development Goals (SDGs)
Clean Economy sub-themes:
AXA IM as at 31/10/2021. For illustrative purposes only.
Low carbon transport
Electric Vehicles (EVs) Battery Enablers
Investing in the low carbon transport value chain from car makers, battery producers & enablers such as connectors, semiconductors etc.
Smart energy
• • •
Renewables & Grid Green Buildings Efficient Factories
Companies supporting the energy transition by producing and supplying renewables energy, digitalising electricity networks and improving energy usage in factories and cities
Agriculture Food Industry
Innovative companies which help improving yield, encouraging people to adopt sustainable food consumption habits or reducing food waste
• •
Water Recycling Waste Management
Businesses which mitigate environmental damage by reducing waste, facilitating recycling, monitoring and resolving pollution
Agriculture & food industry
Natural resource preservation
From our initial universe of listed companies in developed and emerging markets, we create a subset of the companies we think are on the ‘right side’ of the transition to a more sustainable economy. From that subset, we then aim to select high quality businesses best positioned to be the leaders amid the transition.
We try to identify companies for inclusion in our portfolios using our proprietary impact framework based on five pillars to define the businesses that can generate a positive and measurable impact on the environment and therefore have a competitive advantage.
Five pillars of our proprietary impact framework
AXA IM as at 31/10/2021.
Investments should be made with an upfront objective of positive outcomes. Companies can also demonstrate an intentional, strategic commitment to positive impact
There needs to be a clear methodology and commitment to measuring and reporting the social and environmental performance of investments.
Intentionality
Invest in companies where the positive outcomes are of material significance to the beneficiaries, the company, or to both.
Materiality
The extent to which a company is making its ‘needed’ products and services more accessible or commercially viable, for example through innovative new solutions or lower pricing.
Additionality
Company’s corporate practices, or products and services, may significantly undermine the positive impact it is generating elsewhere
Negative consideration
Measurability
Find out more: axa-im.co.uk/evolving-economy/cleantech
Three reasons to invest
1
Dual objective
Seeking to deliver a long-term financial return, while also aiming to achieve a positive and measurable impact on the environment. This is aimed at supporting the energy transition, the reduction of global greenhouse gas emissions and resource preservation across four sub-themes aligned with 6 environmental UN Sustainable Development Goals. The Fund is classified as Article 9 under the EU’s Sustainable Finance Disclosure Regulation.⁶
2
Growth opportunity
Diversified access to multi-decade growth opportunities arising from the transition to a clean economy. Consumers are rapidly shifting towards greener consumption habits across a range of areas including electric vehicles and sustainable diets. This is putting pressure on corporates to offer products and services in a more environmentally friendly way and to develop innovative solutions.
3
Differentiated solution
Benefitting from an active, multi-cap portfolio with a dual thematic/ impact investing approach. Combines AXA IM’s time-tested ‘Evolving Economy’ approach to thematic investing with dedicated ESG and Impact analysts to support the portfolio manager.
⁶ The product categorization is provided based on the basis of the European Directive (EU) 2019/2088 on the sustainability related disclosures in the financial services sector (“SFDR”) and state of knowledge at the time of creation of this document and may change over time.
Performance since inception (%)⁵
1M
YTD
2020
2019
Since inception⁴
AXA WF ACT Framlington Clean Economy I USD - Net
98.5
24.1
46.0
11.6
8.9
MSCI AC World Total Return Net
67.3
26.6
16.3
16.8
5.1
Net relative performance
31.2
-2.5
29.8
-5.2
3.8
⁴ The performances presented above are from the AXA WF ACT Framlington Clean Economy fund, a sub-fund of AXA World Funds and are shown for illustrative purposes only. It has been selected as it follows the same investment process as the AXA ACT Framlington Clean Economy, a sub-fund of the AXA Framlington Range of Authorised Unit Trust Schemes, reshaped in August 2021. The results portrayed relate only to the AXA WF sub-fund and are not indicative of future performances of the UK Unit Trust. An investor’s actual experience may vary. Please refer to the appendices for additional information about the sub-funds. Source: FactSet/Morningstar as at 31/10/2021. Basis: I USD share class, Single Price NAV. The figures presented are gross of fees. An investor’s return will be reduced by the management fees and other expenses. Comparative benchmark: MSCI ACWI . Performance and income are susceptible of varying considerably due to the fluctuations of the exchange rate. ⁵ Inception date refers to 14/12/2018. Performance calculations are based on the reinvestment of dividends. Index’s performance is calculated on the basis of dividends. Performance data do not take account of the commissions and costs incurred on the issue and redemption of units.
Past performance is not a reliable indicator of future results.
Framlington Clean Economy strategy⁴
Key Facts
Portfolio manager:
Amanda O'Toole AXA ACT Framlington Clean Economy
Fund Type
Benchmark
UK Unit Trust
Asset Class
Global equity
28/07/2021 (Inception date of Luxembourg SICAV AXA WF ACT Framlington Clean Economy was 14/12/2018)
AUM in the strategy is c.£800m including c. £65m in the UK Unit Trust
Typically 40-60 stocks
Article 9 (Dark Green)
GB0003499851, GB0003499745, GB00B7G8XW93, GB00BRJZVM34
Inception Date
Fund Size
(as at 30/09/2021)
No. of holdings
EU SFDR Classification
ISIN
Source: AXA IM at 30/09/2021. ³ The product categorization is provided based on the basis of the European Directive (EU) 2019/2088 on the sustainability related disclosures in the financial services sector (“SFDR”) and state of knowledge at the time of creation of this document and may change over time.
Key risks The capital of the Fund is not guaranteed. The Fund is invested in financial markets and uses techniques and instruments which may be subject to sudden and significant variation, which may result in substantial gains or losses. Concentration Risk: as this Fund may, from time to time, hold relatively few investments, it may be subject to greater fluctuations in value than a fund holding a larger number of investments. Currency Risk: the Fund holds investments denominated in currencies other than the base currency of the Fund. As a result, exchange rate movements may cause the value of investments (and any income received from them) to fall or rise affecting the Fund’s value. Further explanation of the risks associated with an investment in this Fund can be found in the prospectus.
Disclaimer Not for Retail distribution: This document is intended exclusively for Professional, Institutional, Qualified or Wholesale Clients / Investors only, as defined by applicable local laws and regulation. Circulation must be restricted accordingly. This promotional communication does not constitute on the part of AXA Investment Managers a solicitation or investment, legal or tax advice. This material does not contain sufficient information to support an investment decision. Due to its simplification, this document is partial and opinions, estimates and forecasts herein are subjective and subject to change without notice. There is no guarantee forecasts made will come to pass. Data, figures, declarations, analysis, predictions and other information in this document is provided based on our state of knowledge at the time of creation of this document. Whilst every care is taken, no representation or warranty (including liability towards third parties), express or implied, is made as to the accuracy, reliability or completeness of the information contained herein. Reliance upon information in this material is at the sole discretion of the recipient. This material does not contain sufficient information to support an investment decision. Before making an investment, investors should read the relevant Prospectus and the Key Investor Information Document / scheme documents, which provide full product details including investment charges and risks. The information contained herein is not a substitute for those documents or for professional external advice. The products or strategies discussed in this document may not be registered nor available in your jurisdiction. Please check the countries of registration with the asset manager, or on the web site https://www.axa-im.com/en/registration-map, where a fund registration map is available. In particular units of the funds may not be offered, sold or delivered to U.S. Persons within the meaning of Regulation S of the U.S. Securities Act of 1933. The tax treatment relating to the holding, acquisition or disposal of shares or units in the fund depends on each investor’s tax status or treatment and may be subject to change. Any potential investor is strongly encouraged to seek advice from its own tax advisors. AXA ACT Framlington Clean Economy Fund is a sub-fund of the AXA Framlington Range of Authorised Unit Trust Schemes (the “Trust”). The Trust is authorised by the FCA and is managed by AXA Investment Managers UK Limited, a company incorporated under the laws of England and Wales with company number 01431068, having its registered office located at 22 Bishopsgate, London EC2N 4BQ. The value of investments, and the income from them, can fall as well as rise and investors may not get back the amount originally invested. Exchange-rate fluctuations may also affect the value of their investment. Due to this and the initial charge that is usually made, an investment is not usually suitable as a short term holding. Issued in the U.K. by AXA Investment Managers UK Limited, which is authorised and regulated by the Financial Conduct Authority in the U.K. Registered in England and Wales, No: 01431068. Registered Office: 22 Bishopsgate, London, EC2N 4BQ.
Sources: ¹ Accenture Covid-19 Consumer Research, conducted March 19–25 and April 2–6, 2020. ² Includes organic, Fairtrade, Rainforest Alliance and Marine Stewardship Council (MSC) certified product. https://bit.ly/3xjV4dB ³ Covid-19 Disruptions in the US Meat Supply Chain, Federal Reserve Bank of Kansas City. ⁴ Popkin, BM, Du, S, Green, WD, et al. Individuals with obesity and Covid‐19: A global perspective on the epidemiology and biological relationships. Obesity Reviews. 2020; 21:e13128. https://bit.ly/3pEP3W3 ⁵ UN Food and Agriculture Organization. ⁶ European Commission.
*
FountainCap Greater China Select UCITS
Mastering three cycles: How to manage volatility in China equity markets
China is a stockpicker’s market, ripe with many long-term investment opportunities. It is also a market with many risks and outsized market volatility. Investors would do well to work with on-the-ground specialists that have a proven and repeatable research and investment process that allows for effective risk and volatility management, while delivering consistent, strong investment results over the long term
C
higher risk premium by derating China equities substantially. The sudden power shortages all over the country, combined with the global value chain disruptions, have weighed down the market further.
hina’s equity market has just experienced a severe downcycle in its technology, internet, education, online gaming and property sectors. This has triggered fears of a major policy reversal from previous years and, consequently, the capital markets have immediately commanded a
Mark Twain once said, “history does not repeat but it often rhymes”. In this article, we are laying out the intercorrelation of the three key cycles to share how we think the China equity market will likely perform in the coming years and why we remain optimistic about long-term China investment.
“As with any developing market, investors should prioritise managing downside volatility when investing in China...the current political cycle has likely reached its nadir”
Intercorrelation of China’s political, economic and market cycles
Three key cycles typically determine China equities' performance – political, economic and market. Since Deng Xiaoping initiated the reform and opening up programme in 1978, China’s capital market movements have been highly correlated with China’s political and economic cycles. Over the past four decades, these three cycles have generated five major bear markets and four major bull markets.
1. Political cycle - uncertainty surrounding the leadership transition is creating market volatility
On the surface, the recent regulatory actions seem sporadic and wide-reaching. Upon closer scrutiny, however, it becomes apparent that these measures only targeted a limited number of sectors and very few companies specifically. The companies that are subjected to these measures are outside the confine of “common prosperity”. Certainly, there are many other companies across different sectors that too can be considered misaligned with “common prosperity”, but none have the influence nor the reach that these companies had. The targeted companies can directly influence the 1.4 billion people in China.
2. Economic cycle – sharp slowdown driven by the nationwide power shortages, global value chain disruption and credit tightening
China is currently experiencing an economic downcycle that has been exacerbated by the energy shortages nationwide. There are three fundamental reasons for the power shortages:
3. Market cycle – negative political and economic cycles lead to positive market cycles
The above table shows five similar cycles over the past 40 years. Political and economic down cycles tend to produce very strong capital market up cycles. Bull market cycles in Hong Kong/China tend to be far larger and longer following major crises as China accelerates post-crisis reform and opening. With a series of harsh regulatory actions over the past 13 months coupled with an economic slowdown, the China market seems to have arrived at a similar low point for both the political and economic cycles. If history is any indication, the bottoming of both the political and economic cycles should be a catalyst for the capital market cycle in the coming years.
As such, the recent policy changes can be interpreted as politically motivated and therefore should be short-term in nature, particularly as China is currently undertaking an intensive but untransparent leadership transition. This transition – with its myriad of political promotions and demotions – occurs once every ten years. Those companies that are directly or indirectly affiliated with current or previous senior officials and leaders are subjected to higher risks. The leadership transition period should be settled by mid-2022, and therefore the market is experiencing a political downcycle at present rather than a structural decline. The direction of China’s reform and open-door policy that started in 1978 remains intact. It can be best described as 'two steps forward and one step back'.
While China is no longer an emerging market in the traditional sense, it is still a developing market and should be viewed with such a lens. As with any developing market, investors should prioritise managing downside volatility when investing in China. The government is likely to address the uncertainties surrounding the recent regulatory changes as they look to shore up the private sector and bolster foreign business confidence ahead of the Winter Olympics and 20th Party Congress in 2022. Therefore, the current political cycle has likely reached its nadir.
Furthermore, China’s “double carbon reduction” initiatives promoted by the government (carbon peak emission by 2030 and carbon neutral by 2060) imply that the supply of energy in China will likely be in a chronic shortage.
Prolonged period of underinvestment in coal generation which accounts for 70% total power capacity.
Supply-side reform that forced the shutdown of many coal mines and reduced 1 billion metric tons of coal capacity, or almost 20% of total output over the past seven years.
Sanctions on cheaper and better Australian coal reduced coal supply.
a) b) c)
China has experienced at least two major power shortage crises over the past 40 years which interrupted factory operations and caused economic slowdowns. However, each time the response was to push forward the necessary power industry reforms. Two case studies are worth sharing.
In 1978 there was a lack of efficient power and private investment to meet fast power demand growth. Many factories were operating for just two or three days a week. Government reform encouraged local investors to invest in generating capacity and imposed a tariff raise by 0.02 yuan (0.32¢)/kWh on industrial end users.
By 1996, the total generating capacity was 3.8 times that in 1978. The second example occurred in 2003, with 26 out of 34 provinces having shortfalls. The government responded by encouraging local governments to make power generation investment decisions independently, beginning a market-oriented restructuring of state-owned power generation assets, and restructuring the former monopolistic State Power Corp. into five independent power generation companies and two power grid companies.
The past stockmarket declines due to energy crises and the subsequent economic slowdowns turned into great long-term investment opportunities. This time should be no exception. One overlooked benefit in the current downcycle is that China was the first major economy to remove post-Covid stimulus, and the credit tightening over the past 12 months has been more dramatic than the previous two downcycles of 2015 and 2018. This scale of credit tightening provides China with plenty of room to boost growth once the leadership transition is complete.
¹ Bloomberg, as of 31/03/2021.
% change of MSCI Indices (World vs. EM vs. China) (Oct-2001 to Sep-2021) ¹
150%
50%
-50%
450%
350%
250%
550%
850%
750%
650%
2001
2002
2003
2004
2005
2006
2007
2008
2009
2010
2012
2013
2014
2015
2016
2017
2018
MSCI China Index
MSCI Emerging Market Index
MSCI World Index
How do China's political, economic and capital market cycles interact?
Political cycle (Reform & Open Up)
Economic cycle (Real GDP growth)
Capital market cycle (Hang Seng Index)
Cycle #1
-9.5% 22.6% 64.3%
11.7% 7.6% (drastic slowdown) 7.8%
Up (Reform started by December) Dip (War between China & Vietnam) Up
1978 1979 1980
Cycle #2
16.9% 5.6% (up 36% since 4 June) 7.7%
11.2% 4.2% (economic hard landing) 3.9%
Peak (Pricing Reform) Hard landing (4 June event) Recovery
1988 1989 1990
Cycle #3
-6.3% 66.8% -11.0%
7.8% 7.7% (hard landing in Guangdong) 8.5%
Up (Property Reform, government restructuring) Down (Falun Gong, bombing of Chinese embassy in Belgrade) Recovery
1998 1999 2000
Cycle #4
-48.3% 52.0% 5.3%
9.7% (14.2% in 2007) 9.4% (bailed out by 4-trillion QE) 10.6%
Peak (Olympic Games) Down Flat
2008 2009 2010
Cycle #5
-14.1% 21.0% 27.3%
6.6% 5.8% 6.5%
Down (Trade war, deleveraging) Recovery (Trade deal phase 1, private sector confidence recovered) Flat (Covid, fiscal stimulus, Ant Financial crackdown)
2018 2019 2020
² As of 30 September 2021
FountainCap Research & Investment (Hong Kong) Co., Ltd. is an independent privately-owned investment management firm with an all-China, all-sectors, all-cap long-only equity strategy. The firm was founded in July 2014 by Frank Ding, an ex-Capital Group investment professional with over 27 years of China investment experience. The firm currently has 21 employees with nine investment professionals. The Chinese economy is undergoing a massive restructuring while its capital market remains structurally inefficient. In such an environment, we believe that bottom-up stockpicking based on thorough fundamental research can discover great investing opportunities for long-term investors. Our process seeks to identify quality companies that operate within three megatrends which are driving China’s growth: the transition to a clean economy, technological innovation, and the middle-class consumption boom.
Below are five points that differentiate our approach:
Seasoned investment team
Before founding FountainCap, Frank spent time at Capital Group, Jardine Fleming Asset Management (now JPM AM) and Manning & Napier, where he was a China specialist. Prior to his investment career he spent four years working within the Beijing government under the National Development and Reform Commission, providing him with unique insights into the thinking and operations of the Chinese government. All our analysts are seasoned sector specialists that are equipped with deep China investment knowledge.
Unique fundamental research
China is best understood as a composition of 34 states (provinces), each with its own economics, demographics, and cultural status. Through our “Backpack” grassroot research, we develop an in-depth understanding of the varying social and economic development factors within different tier cities. Our research analysts travel to lower tiered cities and countryside’s to discover emerging trends and uncover non consensus investment opportunities. This allows us to rigorously test our investment theses, and frequently leads to the discovery of opportunities that have often not yet been identified by the wider market.
Global perspective, local expertise
As the Chinese economy becomes more intertwined with the rest of the world, we believe it is important to have a global perspective while maintaining local expertise when investing.
4
Long-term outperformance
We aim to generate risk-adjusted outperformance over a full market cycle and have a long holding period of between three to five years. We invest with conviction and do not attempt to time the market.
5
ESG integration
FountainCap is a signatory of the UNPRI and ESG considerations are integrated at three stages of our investment process: evaluation of ideas, investment decisions and on-going assessment.
Fund Performance since inception
(April 2015 - September 2021, Net Basis)
The performance charts above are for the FountainCap Global Opportunity Fund (Cayman domiciled), launched in 2015, which pursues a very similar investment strategy to the FountainCap Greater China Select (UCITS) Fund. Performance for FountainCap Greater China Select (UCITS) Fund will be available one year from the launch date. This fund was launched on July 27th 2021
-20%
40%
-60%
20%
0%
60%
120%
100%
80%
140%
200%
180%
160%
Apr-15
Aug-15
Dec-15
Apr-16
Aug-16
Dec-16
Apr-17
Aug-17
Dec-17
Apr-18
Aug-18
Dec-18
Apr-19
Aug-19
Dec-19
Apr-20
Aug-20
Dec-20
Apr-21
Aug-21
FountainCap Global Opportunity Fund (Cayman)
MSCI China
MSCI China All Shares
CSI300 Index
1 Month
-3.3
The Fund
-5.0
-2.7
MSCI China All Shares Index
-4.8
Hang Seng Index
1.5
3 Month
-13.0
-18.2
-13.3
-14.1
-5.9
-11.6
-16.7
-10.7
-8.0
-4.0
1 Year
8.5
-7.3
1.3
6.9
13.6
3 Years
70.3
18.9
35.5
-2.7%
59.3
5 Years
136.6
54.7
56.4
23.4
69.7
Since launch (27.04.15)
143.2
20.4
9.6
7.4
10.7
19.4
5.9
10.6
-0.9
18.8
9.1
9.4
4.3
11.2
Since launch
Annualised Return
14.8
2.9
1.4
1.1
1.6
CSI 300 Index
Performance history (%)
(Net Return in USD as of 30 September 2021)
Mr. Frank Ding Chair & CIO
Strategy Inception Date
Equity
UCITS Inception
MSCI China All Shares Net USD Index
27th April 2015
27th July 2021
US$ 1,486.65m
US$ 43.21m
43
UCITS
UCITS Inception Date:
Strategy AUM
UCITS AUM
# of Holdings
Key Facts²
³ Distributor of the Fund
IMPORTANT INFORMATION. The prospectus, the supplement, the summary of investor rights and the KIID can be obtained by investors and potential investors, free of charge from FountainCap Research & Investment (Hong Kong) Co. Limited; www.fountaincapri.com and Aravis Capital Limited; www.araviscapital.com please contact ir@fountaincapri.com / kit.sanford@araviscapital.com for more detail. The Prospectus for the ICAV and the supplement for the Fund are available in English only. The KIID for the Class I (USD/Accumulating) is available in English, French, German and Swedish. This information is not for use within any country or with respect to any person(s) where such use could constitute a violation of the applicable law. The Fund may invest directly and/or indirectly in equity securities, debt securities, and currencies. There can be no assurance that the Fund will achieve its stated objectives. Comparison to the MSCI China All Shares Total Return is for reference purposes only. The MSCI China All Shares index captures large and mid-cap representation across China A-shares, B-shares, H-shares, Red-chips, P-chips and foreign listings (e.g. ADRs). The index aims to reflect the opportunity set of China share classes listed in Hong Kong, Shanghai, Shenzhen and outside of China. It is based on the concept of the integrated MSCI China equity universe with China A-shares included. Total Return measures the performance of the small to midcap growth segment of the US equity market. It is a total return index which assumes that all cash distributions are reinvested in addition to tracking price movements. The Fund has significant active share, which is a measure of the percentage of stock holdings in a manager’s portfolio that differs from the benchmark index. The Fund may experience significant volatility. There is no guarantee that investors will get back the full amount invested. The value of any investment may increase or decrease over time.
Find out more at: araviscapital.com/ fountaincap-research-investment
Janus Henderson Global Sustainable Equity fund
Sustainable investing – the defining decades
A lot can happen in 30 years. Over the past three decades, we have seen explosive progress in science, technology and communications. In the same timeframe, the need for sustainable practices has become paramount. On the 30th anniversary since the origins of our Global Sustainable Equity team, we take a look at the developments that have shaped sustainable investing and the world we live in today
T
he 1987 paper Our Common Future, otherwise known as the Brundtland Report, provides the origins of sustainable investing. This defined ‘sustainability’ as “development that meets the needs for the present without compromising the ability for future generations to meet their
own needs”. It was upon these principles that the Global Sustainable Equity team began investing four years later.
Here, we look back at the drivers of development.
The pace and intensity of human’s impact on the planet are clear. As the global population has grown, so too has consumption of the Earth’s finite natural resources. This poses the key question that the world is currently grappling with – are we prepared to accept the potentially uncomfortable trade off and cost of moving from an unsustainable linear economic model to a circular economy based around renewable, electric and digital drivers?
¹ Our World in Data, Plastic Pollution, September 2018.
Innovation – potential solutions
The technological architecture of today’s world is built around the internet. Data can be stored, managed and accessed without having to own physical infrastructure such as data servers. This technology, known as ‘cloud computing’, enables efficient, on-demand and multi-platform remote access to a broad network. This technology can help drive sustainability initiatives. A study by Accenture highlighted that if all businesses migrate to the cloud, we could see a 59 million tonne reduction in CO2 emissions, the equivalent of taking 22 million cars off the road.²
Population growth – coming at a cost
As the standard of living improved across much of the world, so did global life expectancy. By 2011, the population reached seven billion – a billion increase on 12 years prior – and the human impact on the environment had become stark. Resource use, waste production and environmental damage have been accelerated by population growth and worsened by consumer habits in a linear economic (take-make-dispose) model. Plastic production has rocketed in the seven decades since its creation, reaching 381 million tonnes in 2015.¹ Meanwhile, atmospheric CO2, which contributes to the warming of the planet, has continued to climb.
Source: ⁹ Bloomberg as of 31 December 2020.
The path to a circular economy
As set out 34 years ago in the Brundtland Report, sustainable development is development which meets the needs of the present without compromising the ability for future generations to meet their own needs. Over the past three decades there has been huge progress in sustainability, yet significant challenges remain and, as things stand, we remain on a destructive path with an economic model that is still linear and fossil fuel driven.
As science and technology have improved, so has our understanding of what is needed to make the planet sustainable. We believe the next step in the planet’s sustainability journey is to decouple growth from the consumption of finite resources by operating through a circular economic model. In this model, the future will be shaped by renewable, electric and digital forces. By continuing to evolve and commit to the technologies already in place we believe it is possible, and essential, to switch to the circular economic model.
The past 30 years has seen great strides in clean technology innovation too, with solar, wind, hydropower, geothermal and tidal energy making up the largest types of renewable energy. Between 1990 and 2018, total worldwide renewable energy supply grew at an average annual rate of 2%, compared to the 1.8% in total energy.³
² Accenture, The green behind the cloud, September 2020.
Batteries are another important component of sustainability and is an area that has seen a huge inflection in innovation over the past decade. To achieve higher penetration of renewable energy, it must be possible to capture, store and use energy when needed. Advances in battery technology have therefore been key to the movement away from fossil fuel dependence.
Lithium-ion batteries, rechargeable batteries found in portable electronics such as mobile phones and laptops, as well as hybrid and battery electric vehicles (EVs), have been game changers. Today’s EVs benefit from the long-range capability and lightweight design afforded by lithium-ion batteries. The past decade has seen lithium-ion battery production surge, leading to an 85% decline in price which has made EVs commercially viable. Last year alone, global EV sales grew by 41%.⁴ ⁵
³ International Energy Agency, Renewables Information, August 2021.
⁴ CNBC, The battery decade: How energy storage could revolutionize industries in the next 10 years, December 2019. ⁵ International Energy Agency, Global electric car sales set for further strong growth after 40% rise in 2020, April 2021.
HEAD TO THE CLOUD: If all businesses migrated to the cloud, the reduction in CO2 emissions would be equivalent to taking 22 million cars off the road
CHARGE ME UP: Recent innovations in lithium-ion battery design have led to longer-range capability on electric vehicles and a decline in price
We believe the next step in the planet’s sustainability journey is to decouple growth from the consumption of finite resources by operating through a circular economic model.
Three decades of doing what we say we do
TEAM’S ACTIONS WITHIN:
Environmental
Social
Governance
General ESG
Janus Henderson Global Sustainable Equity Fund
Our investment philosophy We believe there is a strong link between sustainable development, innovation and long-term compounding growth. Our investment framework seeks to invest in companies that have a positive impact on the environment and society, while at the same time helping us stay on the right side of disruption. We believe this approach will provide clients with a persistent return source, deliver future compound growth and help mitigate downside risk.
Established strategy built on a 30-year history of sustainable investing and innovative thought leadership
Strategy overview
•
High-conviction portfolio with a focus on companies selected for their compounding growth potential and positive impact on the environment and society
Commitment to provide clients with high standards of engagement, transparency and measurement
Portfolio managers
Hamish Chamberlayne, CFA head of Global Sustainable Equites, portfolio manager
Aaron Scully, CFA portfolio manager
Amarachi Seery, CEnv, MIEnvSci, PIEMA sustainability analyst
Peer group benchmark
Peer group usage
IA Global
Comparator
Structure
OEIC
Fund assets
£1.82bn⁶
1 August 1991
Launch date
Index
Index usage
⁶ All data sourced from Janus Henderson Investors (as at 30 September 2021), unless otherwise stated.
⁷ All data sourced from Janus Henderson Investors (as at 30 September 2021), unless otherwise stated.
⁸ All data sourced from Janus Henderson Investors (as at 30 September 2021), unless otherwise stated.
oduced food, worth some €143bn a year.⁶
Cumulative performance – GBP (%) ⁷
Sep 16
Sep 17
Sep 18
Sep 19
Sep 20
Sep 21
Global Sustainable Equity Fund I Acc GBP (net)
Index description: The MSCI World Index is a measure of the combined performance of large and medium sized companies from developed stock markets around the world. It provides a useful comparison against which the Fund’s performance can be assessed over time. Peer group description: The Investment Association (IA) groups funds with similar geographic and/or investment remit into sectors. The fund’s ranking within the sector (as calculated by a number of data providers) can be a useful performance comparison against other funds with similar aims.
10 Years
Since inception
Global Sustainable Equity Fund I Acc GBP (gross)
10.31
17.70
19.00
20.17
24.29
9.39
16.72
18.00
19.17
23.25
9.32
14.95
13.50
12.46
24.06
Peer group benchmark - IA Global
8.03
12.44
12.29
11.65
23.13
Performance – GBP (%) ⁸
Past performance is not a guide to future performance. Returns greater than one year are annualised.
IMPORTANT INFORMATION
All data sourced from Janus Henderson Investors (as at 30 September 2021), unless otherwise stated. Past performance is not a guide to future performance. The value of an investment and the income from it can fall as well as rise and you may not get back the amount originally invested. Tax assumptions and reliefs depend upon an investor’s particular circumstances and may change if those circumstances or the law change. If you invest through a third party provider you are advised to consult them directly as charges, performance and terms and conditions may differ materially. Nothing in this document is intended to or should be construed as advice. This document is not a recommendation to sell or purchase any investment. It does not form part of any contract for the sale or purchase of any investment. Any investment application will be made solely on the basis of the information contained in the Prospectus (including all relevant covering documents), which will contain investment restrictions. This document is intended as a summary only and potential investors must read the prospectus, and where relevant, the key investor information document before investing. We may record telephone calls for our mutual protection, to improve customer service and for regulatory record keeping purposes. Issued in Europe by Janus Henderson Investors. Janus Henderson Investors is the name under which investment products and services are provided by Janus Capital International Limited (reg no. 3594615), Henderson Global Investors Limited (reg. no. 906355), Henderson Investment Funds Limited (reg. no. 2678531), Henderson Equity Partners Limited (reg. no. 2606646), (each registered in England and Wales at 201 Bishopsgate, London EC2M 3AE and regulated by the Financial Conduct Authority) and Henderson Management S.A. (reg no. B22848 at 2 Rue de Bitbourg, L-1273, Luxembourg and regulated by the Commission de Surveillance du Secteur Financier). Janus Henderson and Knowledge. Shared are trademarks of Janus Henderson Group plc or one of its subsidiaries. © Janus Henderson Group plc.
Read the full article here
For further information on the Janus Henderson Global Sustainable Equity Fund
Lyxor Climate ETFs
A science-based solution for low-carbon portfolios
Lyxor’s pioneering Climate ETFs were built to help investors put a climate philosophy into practice. Unlike traditional cap-weighted indices, they select and weight companies that are collectively compatible with the Paris Agreement’s most ambitious 1.5°C global warming scenario, and apply wider ESG criteria
A
s tens of millions of viewers around Europe and the world tuned into the Euro 2020 football competition this summer, their eyes may have picked out a new slogan on the pitch side billboards.
Volkswagen, Europe’s biggest carmaker and one of the competition’s sponsors, was using its prime advertising space to promote its commitment to being carbon-neutral or ‘net zero’ by 2050.
Sometimes we can gauge the public mood by the adverts that companies choose to show them. The choice made by VW to advertise net zero at a European football competition reflects how quickly awareness of climate change has risen among Europeans. This rise is reflected in Google Trends rankings, where searches for ‘net zero’ hit a five-plus year global high in April 2021, and a new peak a few months later in September 2021.
Search data shows what we can already feel from reading the news or watching TV: that more and more companies, investors, and governments are committing to carbon neutrality, to net zero.
Why it feels like everyone is going net zero
If all areas of society – governments, companies, investors, even some normal citizens – are committing to net zero – the question is: why?
The answer is quite simple. If humanity will ever stabilise human-induced global temperature increases, no matter what temperature level is chosen as the maximum, whether it be 2°C or 1.5°C, at some point the planet must reach net zero on greenhouse gas (GHG) emissions. Without net zero, global temperatures will keep rising forever.
On average, temperatures today are more than 1°C higher than the preindustrial level. While temperatures have already increased, going net zero has the power to cap the overall increase at a level that causes the minimum amount of climate change.
When we look at a temperature goal such as 1.5°C, it is important to realise that global temperatures have already risen a significant part of that.
"Net zero": Worldwide search interest on Google (last five years)
Source: Google Trends data, exported 30/9/21, data from 2/10/16 to 19/9/21. The left-hand axis shows “interest over time”, 100 being the peak popularity for a given search term in a given period.
Searches for ‘net zero’ hit a peak in September 2021
Committing to net zero
As investors try to decipher net zero and, in many cases, set their own commitments, one important term to understand is “base year”. Base year refers to the anchor date used in any commitment to reduce emissions. This is just as important as the target year, and generally far less visible.
The EU’s 'Fit for 55' legislation package targets a reduction in GHG emissions of 55% by 2030 (revised up from 40% then 50%). This 55% reduction target is calculated versus a 1990 baseline. The same is true for Germany’s updated 65% reduction target by 2030, and the UK’s 78% - they all use 1990 as a reference point. But the US commitment, for example, is against a base year of 2005.
When interpreting a commitment that promises a percentage decrease by a certain point, an ‘anchor point’ is required to make any sense of it. Someone can say “I will halve my consumption of chocolate” – but do they mean compared to the two bars eaten yesterday, or the 20 bars eaten on this day last month?
Lyxor’s Net Zero 2050 Climate ETFs are anchored to 2019, meaning they immediately reduce the portfolio’s carbon intensity by 50% from its 2019 level. By 2019, the EU had already achieved a 25%reduction in emissions since 1990. In 2019, the UK’s emissions were already 40% below 1990, thanks to decades of coal decommissioning. So, the funds halve an already much-reduced emissions figure – then continue reducing it further each year.
Lyxor’s Net Zero 2050 Climate ETFs use a methodology that applies an immediate 50% reduction in GHG emissions in a portfolio allocation compared to its parent index (for example, an S&P 500 Paris-Aligned ETF refers to the S&P 500 index). But having reduced by 50% – or 30% in the case of the Climate Transition (CTB) ETFs – they then continue to decarbonise from this point at a rate of 7% per year.
This methodology goes beyond the 1.5°C scenario codified in the 2015 Paris Agreement, which requires a 45% reduction in global carbon intensity by 2030 en route to achieving net zero by 2050. As mentioned, the EU targets a more ambitious 55% reduction by 2030. With their immediate 50% reduction and 7% reduction per year afterwards, Lyxor’s Net Zero 2050 ETFs overshoot both of these targets. We predict, therefore, that these ETFs should be net zero sooner than 2050.
Someone can say “I will halve my consumption of chocolate” – but do they mean compared to the two bars eaten yesterday, or the 20 bars eaten on this day last month?
A trajectory for change
Net zero pledges are at best trajectories for change over several years, and those trajectories are based on important assumptions. These assumptions include the ability to decarbonise at a given pace in future, or that there will be development of effective carbon capture and storage solutions to mitigate future emissions.
It is important to be realistic about these assumptions. In some cases, the technology that is expected to deliver improved carbon removal, is still in the theoretical or prototype stage. This fact might explain why the latest report from the IEA, published in May 2021, recommends trajectories based on faster emissions reduction but lower carbon removals. The assumptions can change over time, and an informed investor must understand this.
To illustrate again with Lyxor’s Net Zero 2050 ETFs: earlier, we said that these ETFs should hit net zero before 2050. Our calculations, based on previous modelled trajectories, are that Lyxor’s global Net Zero 2050 ETF would reach net zero between 2043-2045. Based on latest IEA scenario (faster reduction/lower removals), we would expect that figure to be closer to 2049.¹
Source: IPCC, SR1.5 Report (Oct. 2018), scenario: Illustrative Pathway P2. Scope: CO2 only, does not include other GHGs.
¹ Source: Lyxor International Asset Management estimates, October 2021.
² Source: The S&P Net Zero 2050 Paris-Aligned Climate ESG Index Series’ methodology aligns with certain specified criteria through the use of optimization with multiple model constraints including an instant reduction of overall greenhouse gas (GHG expressed in CO2 equivalents) emissions intensity relative to their respective underlying parent indices of at least 50%, and minimum self-decarbonization rate of GHG emissions intensity in accordance with the trajectory implied by Intergovernmental Panel on Climate Change’s (IPCC) most ambitious 1.5ºC scenario, equating to at least 7% GHG intensity reduction on average per annum.
³ Source: SFDR = Sustainable Finance Disclosure Regulation. ⁴ Source: Lyxor International Asset Management as of 05/11/2021.
Billion tonnes CO2 per year (GtC02/yr)
Predicted negative emissions from agriculture, afforestation, and other land use (AFOLU) and bioenergy with carbon capture and storage (BECCS)
One simple act. One big impact.
Severe changes to our climate are all but locked in unless we cut carbon emissions drastically. Governments must lead, but investors now have the tools to make a significant difference. Thankfully, there has never been a better time to invest in our planet.
Lyxor’s Net Zero 2050 Climate ETFs could help halve investors' portfolios' carbon footprint instantly and achieve a 7% decarbonisation rate each year.² Such a move could also help investors insulate themselves from the effects higher carbon prices could have on global equity markets in the future. One simple act. One big impact.
All eight ETFs within Lyxor’s unique ecosystem of CTB (Climate Transition Benchmark) and Net Zero 2050 PAB (Paris-Aligned Benchmark) ETFs align to the EU’s Low Carbon Benchmark standards and are SFDR 9³ compliant. They range across global, US, European and emerging markets, and all share a common goal of limiting global warming to 1.5°C, but the PAB ETFs come with a more aggressive initial carbon intensity reduction and additional fossil fuel exclusions – meaning they could get investors' portfolios to net zero sooner. Together, these funds have now been trusted with over €1.9bn in AUM.⁴
We believe that all market participants should feel equipped with the best possible information to make the right choices – and this includes an ability to look beyond headlines and assess commitments with a clear eye. Our Guide to Net Zero investing was written with this goal in mind, to help investors put the Paris Agreement goals into practice.
Three reasons to choose Lyxor for Climate ETFs
First ecosystem of EU CTB & PAB eligible ETFs in the world
SFDR Article 9 funds³
ESG selectivity improves portfolio ESG scores
Discover our guide to Net Zero investing
IMPORTANT INFORMATION For professional clients only. Capital at risk. This communication is for the exclusive use of investors acting on their own account and categorised either as “Eligible Counterparties” or “Professional Clients” within the meaning of Markets in Financial Instruments Directive 2014/65/EU. These products comply with the UCITS Directive (2009/65/EC). Société Générale and Lyxor International Asset Management (LIAM) recommend that investors read carefully the “investment risks” section of the product’s documentation (prospectus and KIID). The prospectus and KIID are available free of charge on www.lyxoretf.com, and upon request to client-services-etf@lyxor.com. Except for the United-Kingdom, where this communication is issued in the UK by Lyxor Asset Management UK LLP, which is authorized and regulated by the Financial Conduct Authority in the UK under Registration Number 435658, this communication is issued by Lyxor International Asset Management (LIAM), a French management company authorized by the Autorité des marchés financiers and placed under the regulations of the UCITS (2014/91/EU) and AIFM (2011/61/EU) Directives. Société Générale is a French credit institution (bank) authorised by the Autorité de contrôle prudentiel et de résolution (the French Prudential Control Authority). A summary of your Investors’ Rights is available at: www.lyxor.com/en/investors-rights-2021-en.
Matthews Asia ex Japan Dividend fund
Navigating Asia’s next style rotation
A portfolio that blends dividend growth stocks and stable yielding stocks depending on market conditions can offer investors participation in both growth and value markets
U
ncertainties around interest rates, inflation fears, a trade war between the US and China, and series of Chinese regulations targeted mostly at high profile, large-cap internet names created high levels of market volatility across Asia.
2021 demonstrates how quickly things can change. A semi-synchronised global economic recovery gained momentum throughout the first half of the year and led to a market rotation from growth to value-orientated companies. Towards the end of the second quarter, markets rotated back into growth stocks. During the third quarter, most equity markets in the Asia ex Japan region weakened as debt-related issues in the real estate sector and policy risks in China came to the fore, and continued supply-chain disruptions seemed to weigh on the prospects for normalisation in industries such as automobiles and semiconductors.
In times like these, a flexible approach that can balance exposure to quality growth and more cyclically sensitive stocks can help investors navigate markets driven by different styles.
The Matthews Asia ex Japan Dividend fund offers such an approach. It blends dividend-growth stocks and dividend payers depending on market conditions, offering investors participation in both growth and value markets.
The fund leverages our expertise to invest in Asian growth companies using a dividend approach that aims to lower volatility. By constructing a portfolio that balances higher-yielding dividend payers with dividend-growth stocks, we seek to deliver attractive total return through capital appreciation and the provision of income.
With over 30 years of experience of investing in Asia, we have a track record of developing deep insights into companies, which allows us to understand their long-term prospects and construct a portfolio that adopts a different approach.
¹ Data period 30 November 2015 to 30 September 2021. Source: Zephyr Style ADVISOR
Leveraging insights into small caps and smaller markets
In our view, dismissing ‘low-yielding, poor governance’ markets without due diligence is often detrimental to portfolios. It is only by looking at businesses close up that we can identify quality companies that are capable of delivering sustainable growth through market cycles.
Since inception, the fund outperformed its benchmark in a variety of market environments. The Matthews Asia ex Japan Dividend fund outperformed in a variety of market environments since inception. It achieved attractive risk-adjusted return with an upside capture of 95%, a downside capture of 67%, beta of 0.85 and a Sharpe ratio of 1.07.¹
As always, we are mindful about how much we pay for the shares of businesses. As fundamental, bottom-up investors, we pay close attention to whether risks have been priced in correctly and valuations are attractive and in our view, Asian equities today provide intriguing opportunities for active investors.
Positioning for an early earnings recovery
In the first half of the year, for example, we nearly doubled the portfolio’s exposure to Vietnam to 7%. Despite the recent setback from the Covid-19 pandemic, Vietnam’s structural growth, and many of its listed companies, still attracts investors and Vietnamese shares have rallied year-to-date after significant underperformance in 2020.
Dividends provide a powerful signal
The last five years prove that a total-return approach focused on balancing dividend yield with dividend growth can be effective when investing for growth in Asia. A company’s ability and willingness to pay and grow dividends can be a powerful signal reflecting the strength of a business model and the interest alignment among all shareholders in our view.
Heading into the second half of the year, and beyond, it is our view that cyclical businesses are likely to lead the early earnings recovery phase. At the same time structural growth drivers, such as domestic consumption and industrial upgrades, could return to drive further earnings growth, particularly in China.
We have positioned the portfolio accordingly. While the portfolio ended first quarter 2021 roughly balanced between dividend payers and growers, in the second quarter it favoured dividend growers as we took advantage of the volatility to add growth names that were indiscriminately sold off during the correction.
From an income point of view, undiscovered small and mid-cap Asian companies, which have not yet realised their full growth potential, are often overlooked. These businesses may offer an interesting overlap between delivering growth and returning this growth in the form of dividends. Often these can be fast growing businesses where the original founder/family is still the majority shareholder.
For small caps, dividends are a significant source of income and cash flow, and therefore are more likely to be resilient in their dividend policy and may emerge quicker from a coronavirus lockdown. In addition, at the early stages of a cyclical rebound of both the economy and corporate earnings, small caps tend to bounce more owing to their larger operating leverage.
In our experience, performance also comes from knowing where to look in terms of sectors and countries. Our focus is on finding those quality companies that are benefitting from rising domestic consumption across a broad range of sectors and countries, including fast growing markets in emerging and frontier Asia. We believe these markets may not only offer alpha opportunities, but also help to mitigate macroeconomic risks.
Performance comes from knowing where to look
Undiscovered small- and mid-caps
Meaningful exposure to small- and mid-cap companies that have not yet realised their full growth potential and are often overlooked from an income point of view
Diversified range of sectors and countries
A focus on finding quality companies benefitting from rising domestic consumption across a broad range of sectors and countries that include fast-growing markets in emerging and frontier Asia
Flexible exposure to growth and value
The portfolio blends dividend growth stocks and stable yielding stocks depending on market conditions, offering investors participation in both growth and value markets
The fund balances dividend payers with dividend growers
Dividend payers
Often found in mature industries, such as telecoms, utilities, infrastructure assets and consumer staples
Dividend growers
Often small- to mid-cap companies that occupy strong market positions in areas that cater to the growing middle class, such as consumption, services and health care
Matthews Asia ex Japan Dividend Fund
About Matthews Asia Matthews Asia believes in the long-term growth of Asia, one of the world's fastest-growing regions. Since 1991, we have focused our efforts and expertise in these countries, investing through a variety of market environments. Matthews Asia employs a bottom-up, fundamental investment philosophy with a focus on long-term investment performance. As of 30 September 2021, Matthews Asia had US$28.7 billion in assets under management.
Yu Zhang, CFA Lead manager
Sherwood Zhang, CFA, Co-manager
S. Joyce Li, CFA Co-manager
Robert J. Horrocks, PhD, Co-manager
MSCI All Country Asia ex Japan Index
30 November 2015
Base Currency
USD
$519.4 million
61
Total # of Positions
*****
Morningstar Rating
Market Cap Exposure (%)³ ⁴
Fund
25.4
5.6
33.1
27.9
8.0
Cash and other assets, less liabilities
Benchmark: 0.0 Difference: 8.0
Small cap (under $3bn)
Benchmark: 1.3 Difference: 26.6
Mega cap (over $25bn)
Benchmark: 63.8 Difference: -38.4
Large cap ($10bn- $25bn)
Benchmark: 20.4 Difference: -14.8
Mid cap ($3bn- $10bn)
Benchmark: 14.4 Difference: 18.7
³ Percentage values in data are rounded to the nearest tenth of one percent; the values may not sum to 100% due to rounding. Percentage values may be derived from different data sources and may not be consistent with other Fund literature. ⁴ Equity market cap of issuer. Data as of 30 September 2021. Source: FactSet Research Systems.
Risk considerations The value of an investment in the Fund can go down as well as up and possible loss of principal is a risk of investing. Investments in international and emerging market securities may involve risks such as social and political instability, market illiquidity, exchange-rate fluctuations, a high level of volatility and limited regulation. The Fund invests in holdings denominated in foreign currencies, and is exposed to the risk that the value of the foreign currency will increase or decrease. The Fund invests primarily in equity securities, which may result in increased volatility. There is no guarantee that the Fund or the companies in its portfolio will pay or continue to pay dividends. These and other risks associated with investing in the Fund can be found in the Prospectus.
43.66%
25.57%
126.77%
59.81%
152.89%
85.38%
Income return
Capital return
Total return including fees and expense accruals
Both income and capital can drive returns
Cumulative returns: 30 November 2015 through 30 September 2021
Asia ex Japan Dividend Fund (I Acc, USD)
Past performance is no guarantee of future results. Returns are calculated with a holdings-based methodology using software supplied by FactSet Research Systems, Inc. Income Return and Capital Return are for positions only and exclude fees and expense accruals. Returns will not equate to the standard, published performance for the Fund. The characteristics shown may not be representative of the Fund's current or future investments. Indexes are unmanaged and it is not possible to invest directly in an index. Source: FactSet Research Systems, Inc.
2021
Matthews Asia ex Japan Dividend Fund (USD)
19.06
11.01
1.79
31.32
24.49
MSCI All Country Asia ex Japan Index (USD)
23.02
1.74
-3.15
18.16
14.73
Matthews Asia ex Japan Dividend Fund (GBP)
15.25
13.95
7.82
26.07
18.77
MSCI All Country Asia ex Japan Index (GBP)
19.11
4.67
2.49
12.63
10.00
Rolling 12 Month Returns (%) - I (Acc) ⁵
⁵ For the period ended 30/09/2021. Source: Brown Brothers Harriman (Luxembourg) S.C.A.
All performance quoted represents past performance and is no guarantee of future results. Investment return and principal value will fluctuate with market conditions so that when redeemed, shares may be worth more or less than the original cost. Current performance may be lower or higher than performance shown. Investors investing in Funds denominated in non-local currency should be aware of the risk of currency exchange fluctuations that may cause a loss of principal. Performance details provided are based on a NAV-to-NAV basis with any dividends reinvested, and are net of management fees and other expenses.
Information provided is for all holdings in the Matthews Asia ex Japan Dividend portfolio as of December 31 for each respective year. Matthews Asia defines the categories of dividend payers and dividend growers based on qualitative assessments. Dividend payers include companies with stable cash flow business models and high payout ratios, companies with high dividend yields that Matthews Asia believes have ability to maintain their absolute dividend payment over the medium term, and companies in business turnaround situations that Matthews Asia believes are conducive for high dividend payout in the future. Dividend growers include companies with low present dividend payout ratios and high future dividend growth that Matthews Asia believes are supported by high cash flow growth and shareholder return policy enhancement in the future. There is no guarantee that future dividend growth will be achieved. There is no guarantee that the composition of the portfolio will remain unchanged or that the companies in the portfolio will achieve their forecasted dividend growth rate, maintain or grow their dividend pay-out ratio, or pay dividends. Past yields are no guarantee of future yields. Source: Matthews Asia.
45%
59%
55%
41%
63%
48%
37%
52%
58%
42%
Evolution of the Asia ex Japan Dividend portfolio
For Institutional/Professional Investor use only.
The Fund is a sub-fund of Matthews Asia Funds SICAV, an umbrella fund, with segregated liability between sub-funds, established as an open-ended investment company with variable capital and incorporated with limited liability under the laws of Luxembourg. This document is not a Prospectus/Offering Document and does not constitute an offer to the public. This is not intended for distribution or use in any jurisdiction in which such distribution, publication, issue or use is not lawful. Investors should not invest in a Fund solely based on the information in this document. An investment in Matthews Asia Funds may be subject to risks, such as social and political instability, market illiquidity, exchange-rate fluctuations, a high level of volatility and limited regulation. The current prospectus, Key Investor Information Document or other offering documents (“Offering Documents”) contain this and other information and can be obtained by visiting global.matthewsasia.com. Please read the Offering Documents carefully before investing as they explain the risks associated with investing in international and emerging markets. It is the responsibility of any persons wishing to subscribe for shares to inform themselves of and to observe all applicable laws and regulations of any relevant jurisdictions. An investment in the Matthews Asia Funds is not available in all jurisdictions. The Fund’s shares may not be sold to citizens or residents of the United States or in any other state, country or jurisdiction where it would be unlawful to offer, solicit an offer for, or sell the shares. No securities commission or regulatory authority has in any way passed upon the merits of an investment in the Fund or the accuracy or adequacy of this information or the material contained herein or otherwise. The information contained herein has been derived from sources believed to be reliable and accurate at the time of compilation, but no representation or warranty (express or implied) is made as to the accuracy or completeness of any of this information. Matthews Asia and its affiliates do not accept any liability for losses either direct or consequential caused by the use of this information. The views, opinions and information discussed herein are as of the date of publication, are subject to change and may not reflect current views. The views expressed should not be relied upon as investment advice regarding a particular investment or markets in general. Matthews Asia is the brand for Matthews International Capital Management, LLC and its direct and indirect subsidiaries. Matthews International Capital Management is the Investment Manager to the Matthews Asia Funds, and is a U.S.-based investment adviser registered with the U.S. Securities and Exchange Commission. In the UK, this document is only made available to professional clients and eligible counterparties as defined by the Financial Conduct Authority (“FCA”). Issued in the UK by Matthews Global Investors (UK) Limited (“Matthews Asia (UK)”), which is authorised and regulated by the FCA, FRN 667893. ©2021 Matthews International Capital Management, LLC
Click here for further information on the Matthews Asia ex Japan Dividend Fund
T. Rowe Price Global Impact Equity Strategy
Impact investing: investing in an era of change
Q&A with Hari Balkrishna, portfolio manager at T. Rowe Price, on understanding the required foundation to build, manage, and measure an impact portfolio
I
create impact in public equity markets has broadened tremendously over the past decade.
mpact investing brings a non-financial dimension to the investment process – a values-based approach that seeks positive environmental and/ or social impact as part of distinct performance targets. While originally the domain of private investors, we believe the potential to capture and
I think public markets are essential to achieving the collective goals of society. In its purest form, supplying new capital to an entity that could not otherwise access capital to generate its intended positive impact is the origin of impact investing. While impact investing has deep roots in private capital and philanthropy, solving for today’s elevated and global environmental and social pressure points demands a complementary approach. In public equity markets, this means understanding, addressing, and aligning the interests of stakeholders—including shareholders, fiduciaries, and listed corporates—to capture, accelerate, and pursue positive outcomes.
Given the magnitude of the world’s environmental and social challenges, we believe that private markets alone will not suffice to build the required solutions to the very real and complex friction points that exist for our planet and global community. To match the magnitude of the issue with a magnitude of response, governments, capital owners, and asset managers must work together to incentivise and align listed businesses with better practices. Impact investing is one way to do this by adding a perspective into the investment process directed at the broader consequences of a business’s operations.
¹ Five dimensions of Impact Framework: We use this framework to carry out impact due diligence of a given stock. This provides a comprehensive assessment of the impact of a company, which is analysed across the following dimensions: • What outcome is occurring in the period? • Who experiences the outcome? • How Much of the outcome is occurring (scale, depth and duration)? • Contribution—would this change likely have happened anyway? • Risk—what is the risk to people and planet if impact does not occur as expected?
“We aspire to be a partner to our clients, using our full breadth of ideas to harvest both impact and alpha over the long term...”
Hari Balkrishna, portfolio manager
How do you make a difference for clients as an impact investment manager?
Can public equity investing really make an impact on key environmental and social concerns, especially when compared with private investing?
We aspire to be a partner to our clients, using our full breadth of ideas to harvest both impact and alpha over the long term, while managing for risk, given challenging times, will invariably come to our natural habitat of investing.
How does an investment manager contribute to positive impact?
Impact is achieved within an investment portfolio in more ways than simply owning and capturing the economics and activities of certain types of companies. It involves directing fresh capital towards desired impact outcomes, alongside impact-oriented company engagement, proxy voting, and the associated influence feedback loop.
Impact investing has grown tremendously in recent years, and we do not believe there needs to be a sacrifice of return potential in order to implement a values-based approach. This is directly linked to how positive environmental and social outcomes are becoming more measurable, which in turn is being reflected in the economic potential of a business.
Source: As of 30 September, 2021. Numbers may not total due to rounding. The representative portfolio is an account in the composite we believe most closely reflects current portfolio management style for the strategy. Performance is not a consideration in the selection of the representative portfolio. The characteristics of the representative portfolio shown may differ from those of other accounts in the strategy. Source: T. Rowe Price uses a proprietary custom structure for impact pillar and sub-pillar classification. Cash weight was 0.44% as of 30 September 2021.
Part of my role as an impact investor is helping individuals and institutions make sense of what’s happening in the world around us and how that could manifest into risks and opportunities within investment portfolios.
How does your portfolio differ from the theme/factor of ESG, sustainability, or even impact?
It is important to distinguish that impact investing is not environmental, social, and governance (ESG) integration, and it is also a different discipline from sustainable investing. It does, however, incorporate both but also takes a step further.
How do you approach the challenge of data and measurement in the impact sphere?
With a forward-looking perspective and a combination of aggregate analysis where it makes sense, along with individual and holistic analysis where it does not. To be clear, data to measure impact today remain incomplete, while common standards of impact measurement have not been developed on a par with performance/ returns analysis. This makes impact measurement inescapably complex.
The challenge for the industry is that impact investing lives in a complex world of risk and opportunity—one of great change and disruption. The solution for us is to be a good partner and contribute to innovation in the field of impact measurement and reporting, helping clients navigate this journey with the data and trust they need. Leveraging multiple dimensions of our research expertise (both responsible and fundamental) while investing for clients in the field of responsible investing and impact reporting will, we believe, be a real advantage over the long term.
Impact investing in public equity markets lives in the same domain as other styles of investing. We do not believe there needs to be a sacrifice of return potential, and we believe the opportunity set is unrecognisable from a decade ago. However, impact investing backed by stockpicking outcomes requires equal if not greater levels of due diligence in research to avoid excessive concentration, crowding, and disappointment. In our view, a forward-looking perspective, a stable and expert research foundation, and a good level of imagination will be key features of successful investment processes.
As a starting point, it is important to screen companies from an impact lens for both materiality and measurability of the desired outcome. This requires an understanding of a business in the context of a defined impact framework expressing clear principles and intentions, and identifying businesses that are best in class. For us, this is driven by a combination of evaluating a company’s current and future operations and the alignment of earnings or revenues with the United Nations Sustainable Development Goals (UN SDGs), with a holistic perspective on a business, using the five dimensions of impact framework.¹
As a truly global asset manager, we are ready to supply new capital to areas of target impact. We will also use our position of ownership to enter into dialogues with companies where we can see the potential to accelerate the good aspects of their operations, while helping to mitigate the negative externalities that naturally exist even in the purest of business operations.
“As a truly global asset manager, we are ready to supply new capital to areas of target impact”
Global Impact Equity Representative Portfolio
We use a decision‑making structure based on three impact pillars (Climate and Resource Impact, Social Equity and Quality of Life, and Sustainable Innovation and Productivity) and eight sub‑pillars, so we can maintain breadth of impact and objectively manage position size
Climate and Resource Impact
Reducing Greenhouse Gases (GHGs)
Promoting Healthy Ecosystems
Nurturing Circular Economies
Enabling Social Equity
Improving Health
Enhancing Quality of Life
Sustainable Technology
Building Sustainable Industry and Infrastructure
43%
31.6%
8.6%
2.3%
19.0%
4.7%
27.5%
0.0%
5.9%
51%
6%
Social Equity and Quality of Life
Sustainable Innovation and Productivity
IMPORTANT INFORMATION This material is being furnished for general informational and/or marketing purposes only. The material does not constitute or undertake to give advice of any nature, including fiduciary investment advice, nor is it intended to serve as the primary basis for an investment decision. Prospective investors are recommended to seek independent legal, financial and tax advice before making any investment decision. T. Rowe Price group of companies including T. Rowe Price Associates, Inc. and/or its affiliates receive revenue from T. Rowe Price investment products and services. Past performance is not a reliable indicator of future performance. The value of an investment and any income from it can go down as well as up. Investors may get back less than the amount invested.The material does not constitute a distribution, an offer, an invitation, a personal or general recommendation or solicitation to sell or buy any securities in any jurisdiction or to conduct any particular investment activity. The material has not been reviewed by any regulatory authority in any jurisdiction.Information and opinions presented have been obtained or derived from sources believed to be reliable and current; however, we cannot guarantee the sources' accuracy or completeness. There is no guarantee that any forecasts made will come to pass. The views contained herein are as of the date noted on the material and are subject to change without notice; these views may differ from those of other T. Rowe Price group companies and/or associates. Under no circumstances should the material, in whole or in part, be copied or redistributed without consent from T. Rowe Price.The material is not intended for use by persons in jurisdictions which prohibit or restrict the distribution of the material and in certain countries the material is provided upon specific request. It is not intended for distribution to retail investors in any jurisdiction.Issued and approved by T. Rowe Price International Ltd, 60 Queen Victoria Street, London, EC4N 4TZ which is authorised and regulated by the UK Financial Conduct Authority. © 2021 T. Rowe Price. All Rights Reserved. T. ROWE PRICE, INVEST WITH CONFIDENCE, and the Bighorn Sheep design are, collectively and/or apart, trademarks or registered trademarks of T. Rowe Price Group, Inc.202111-1911326
Read the full Q&A here
WATCH: Hear from our portfolio manager, Hari Balkrishna